
Descrizione
Questo indicatore identifica le zone di liquidità e i blocchi d'ordine nel mercato, seguendo i concetti della Smart Money Market Theory (ICT/SMC).
https://ctrader.com/pt/products/1560
https://ctrader.com/pt/products/1386
L'indicatore opera in quattro fasi principali:
✅Identificazione del Blocco d'Ordine
Rileva movimenti impulsivi (minimo 20 pips di default)
Individua zone di consolidamento prima dell'impulso
Classifica come blocco di acquisto o vendita
✅Identificazione della Pool di Liquidità
Segna massimi e minimi recenti come zone di liquidità
Queste aree rappresentano potenziali obiettivi o punti di arresto
✅Conferma del Retest
Controlla quando il prezzo ritorna ai blocchi d'ordine
Conferma con pattern di inversione (Pin Bar/Engulfing) e volume
✅Visualizzazione sul Grafico
Disegna blocchi d'ordine e zone di liquidità
Emette avvisi sonori alla conferma
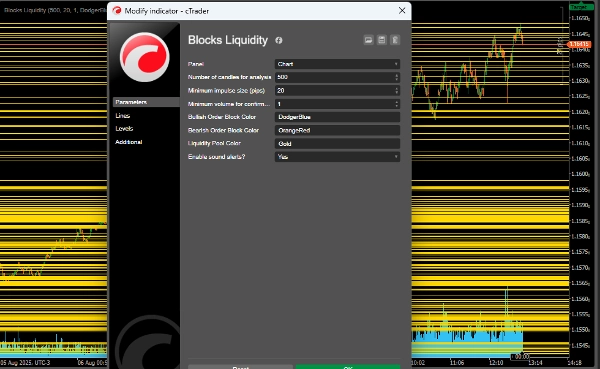
✅Parametri Configurabili
LookbackPeriod: Numero di candele da analizzare (500 di default)
MinImpulsePips: Dimensione minima del movimento impulsivo (20 pips)
MinVolumeThreshold: Volume minimo per la conferma (1.0)
Colori personalizzabili per blocchi rialzisti/ribassisti e zone di liquidità
Opzione di avviso sonoro
✅Logica di Trading
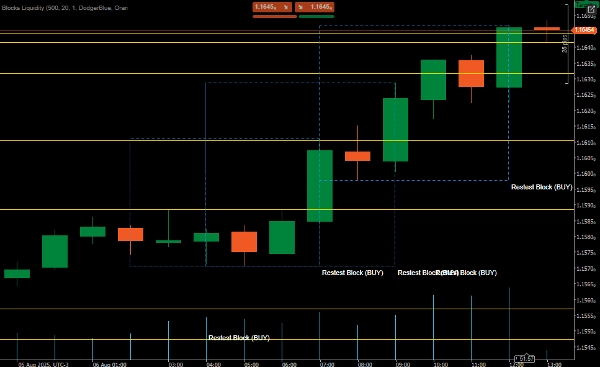
Blocchi rialzisti (acquisto):
Formati dopo consolidamento e slancio verso l'alto
Potenziale zona di supporto
Ingresso confermato da pattern di inversione + volume al retest
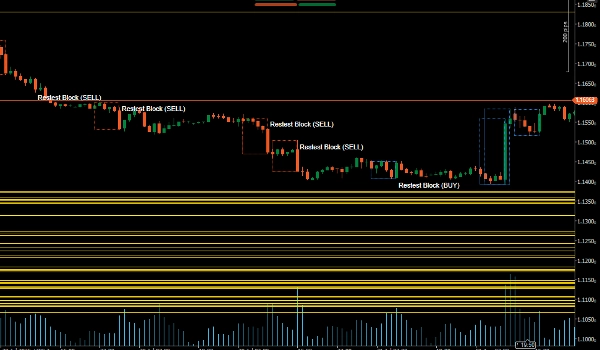
Blocchi ribassisti (vendita):
Formati dopo consolidamento e slancio verso il basso
Potenziale zona di resistenza
Ingresso confermato allo stesso modo
✅Pool di Liquidità:
Massimi/minimi recenti come obiettivi o stop
Aree dove è probabile la concentrazione di ordini stop
Riepilogo
Key features include:
- Order Block Identification: Detects bullish and bearish blocks formed after consolidation and momentum shifts, serving as potential support or resistance zones.
- Liquidity Pool Identification: Highlights recent highs and lows that may act as targets or stop areas due to stop order concentration.
- Retest Confirmation: Validates entries by checking price returns to order blocks combined with reversal candlestick patterns (Pin Bar, Engulfing) and volume thresholds.
- Chart Visualization: Draws order blocks and liquidity zones with customizable colors and provides sound alerts upon confirmation.
- Configurable parameters such as lookback period, minimum impulse size, and volume threshold allow adaptation to different trading preferences.
This indicator supports analysis of price action dynamics to assist traders in identifying key market levels and potential trade entry points.
Recensioni dei clienti
5 | 100 % | |
4 | 0 % | |
3 | 0 % | |
2 | 0 % | |
1 | 0 % |