
Market Sessions_noSourceCode
Индикатор
272 скачивания
Версия 1.0, Feb 2025
Windows, Mac
Описание
Сводка
ИИ-сводка
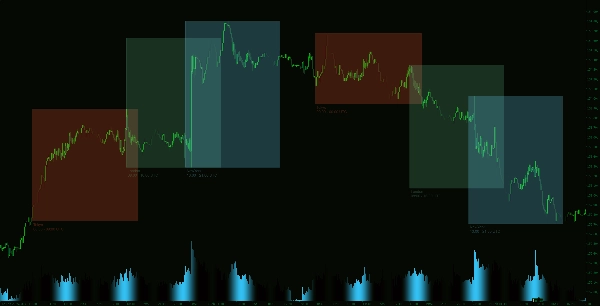
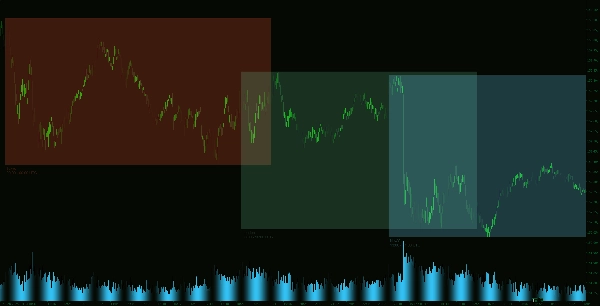
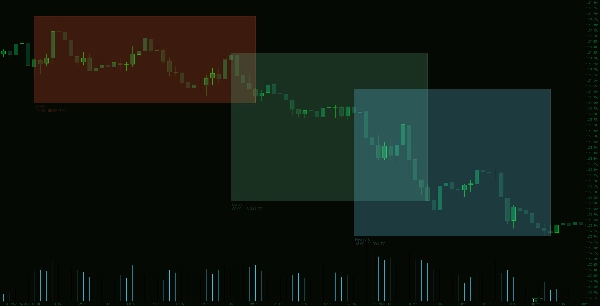
The Market Sessions Indicator is a trading tool designed to visually display the major market sessions—Tokyo, London, and New York—directly on trading charts. It highlights these sessions using customizable colors, allowing traders to tailor the appearance to their chart themes. The indicator draws rectangles representing each session’s high and low price ranges, providing a clear visual reference of market activity during these periods. Users can select how many previous days (up to 10) of session data to display, enhancing historical context. Additionally, the session highlights can be configured as filled or outlined rectangles, aiding in quick identification of active market zones. This indicator supports enhanced market session tracking to assist traders in analyzing price movements relative to global trading hours.
Профиль индикатора
Отзывы покупателей
0.0
Отзывы: 0
Отзывы покупателей
У этого продукта еще нет отзывов. Уже попробовали его? Поделитесь впечатлениями!
Обсуждение
Частые вопросы
Продукты, доступные в cTrader Store, включая торговых ботов, индикаторы и плагины, предоставляются сторонними разработчиками и доступны исключительно в информационных и технических целях. cTrader Store не является брокером и не предоставляет инвестиционные консультации, персональные рекомендации или какие-либо гарантии будущей доходности.


Цена
С 14/01/2025
55
Продажи
11.53K
Бесплатные установки