Mô tả
🚀 Hơn 10.000 nhà giao dịch đã sử dụng các chỉ báo hàng đầu của chúng tôi 🏆
👉 Nhận tất cả các hệ thống hàng đầu của chúng tôi tại đây:
_______________________________________________
📌 Chỉ báo Cấu trúc Thị trường
· ✅ AdvancedMarket Structure: Bos, Choch, SwinLevels, Order Blocks, Market Structure& Liquidity Finder
· 🔄 Dynamic Market StructureAnalysis of Turning Points
· 🧱 Order Block
· ⚖️ Market Imbalance
· ⛓️ BOS & CHOCH
· 🧠 ICT Power of 3
_______________________________________________
🔚 Hệ thống Thoát thông minh
· 📍 Thuật toán thông minh theo dõi
_______________________________________________
📐 Chỉ báo ZigZag
· 🔍 ZigZag Price LiquidityProjection
· ➖ ZigZag
· 🎯 Trình theo dõi Cực điểm Zig-Zag
_______________________________________________
🧱 Chỉ báo Hỗ trợ & Kháng cự
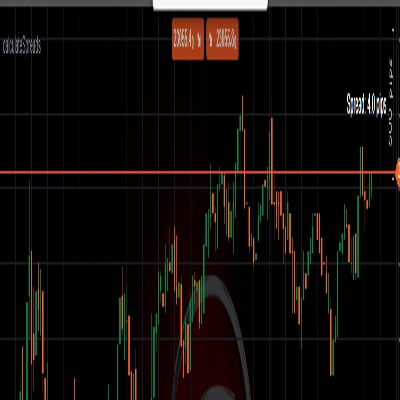
· 🟩 Đường Hỗ trợ & Kháng cự SmartTrend
· 🧱 Tất cả các mức Hỗ trợ và Kháng cự
_______________________________________________
📊 Chỉ báo Xu hướng & Kênh
· 📊 Supertrend
· ⚡Bộ Phân tích Xu hướng Động lượng
· ⭐ KÊNH SSL CAO CẤP
_______________________________________________
💧 Công cụ Khối lượng & Thanh khoản
· 🔍 Khoảng cách Giá trị Công bằng Động lượng
· 🕒 Phiên Khoảng cách Giá trị Công bằng
_______________________________________________
⚡ Chỉ báo Động lượng & RSI
· 🔎 Theo dõi Định hướng Nến Đa cấp
Tracker
_______________________________________________
🔮 Công cụ Dự đoán & Chiếu dự báo
· 📐 Dự đoán dựa trên Linreg& ATR
· 📏 Hồi quy tuyến tính Fibonacci Đa khung thời gian
· 📈 Máy chiếu Dòng chảy Thị trường dựa trên Khối lượng
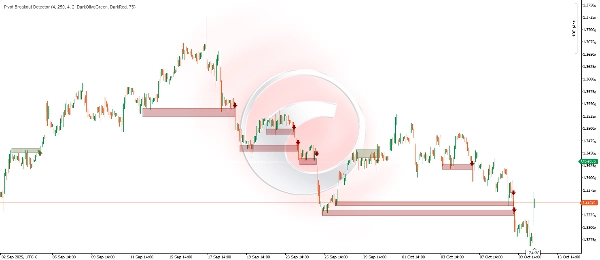
📊 Bộ phát hiện Phá vỡ Pivot
🎯 **Nó là gì và dùng để làm gì?**
https://ctrader.chartshots.net/c/68e935cb9f52a
Bộ phát hiện Phá vỡ Pivot là một chỉ báo kỹ thuật tiên tiến được thiết kế để tự động xác định các đột phá quan trọng từ các vùng tích lũy giá. Chỉ báo này phân tích hành vi lịch sử của thị trường để phát hiện các khu vực mà giá đã nhiều lần "đẩy bật" (tạo ra kháng cự hoặc hỗ trợ) và cảnh báo bạn khi một đột phá với động lượng cuối cùng xảy ra.
**Tiện ích chính:**
• Xác định cơ hội giao dịch trong các đột phá đã được xác nhận
• Tránh các đột phá giả thông qua xác thực chạm nhiều lần
• Hiển thị trực quan các vùng hỗ trợ và kháng cự động quan trọng
• Nắm bắt các chuyển động bùng nổ sau các giai đoạn tích lũy
________________________________________
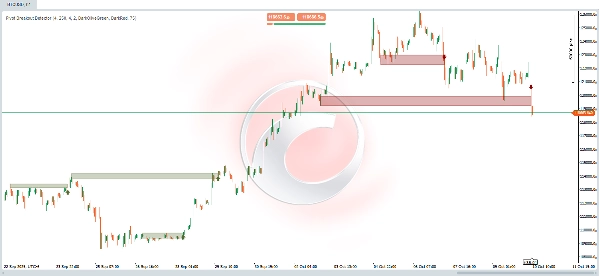
🔍 **Nó hoạt động như thế nào? - Logic cơ bản**
**Giai đoạn 1: Phát hiện các Pivot quan trọng**
https://ctrader.chartshots.net/c/68e9368eb6e7c
Chỉ báo liên tục quét biểu đồ để tìm các điểm pivot - các đỉnh và đáy cục bộ đại diện cho nơi giá thay đổi hướng đi. Các pivot này rất quan trọng vì chúng đánh dấu các mức mà trước đây có sự quan tâm của người mua hoặc người bán.
**Giai đoạn 2: Xác định các vùng tích lũy**
Khi các pivot được phát hiện, chỉ báo nhóm những pivot gần nhau (trong ngưỡng có thể cấu hình). Khi nhiều pivot tập trung trong một phạm vi giá hẹp, điều này cho thấy một vùng tích lũy - khu vực mà giá đã nhiều lần bị từ chối.
**Giai đoạn 3: Xác nhận đột phá**
Chỉ báo kiên nhẫn chờ đợi cho đến khi giá có thể:
1. Đóng cửa trên (đột phá tăng) hoặc dưới (đột phá giảm) vùng đã xác định
2. Thực hiện với một cây nến có hướng đi mạnh (đóng cửa xa so với mở cửa)
3. Vượt qua đỉnh/đáy ngắn hạn gần đây
**Giai đoạn 4: Xác thực cuối cùng**
Trước khi tạo tín hiệu, nó kiểm tra rằng:
• Có đủ số lần "chạm" trước đó trong vùng (tối thiểu có thể cấu hình)
• Giá chưa vượt qua mức đó gần đây
• Mở cửa của cây nến đột phá nằm trong phạm vi hợp lệ
________________________________________
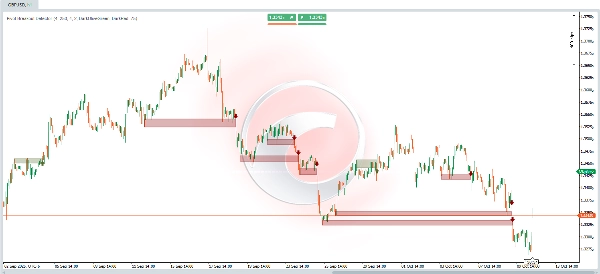
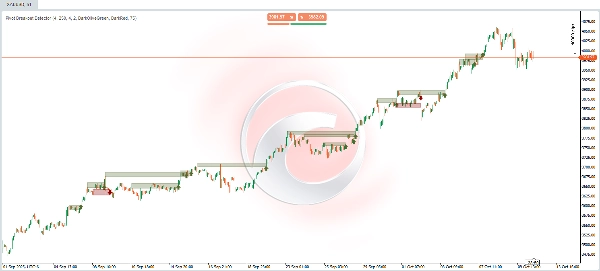
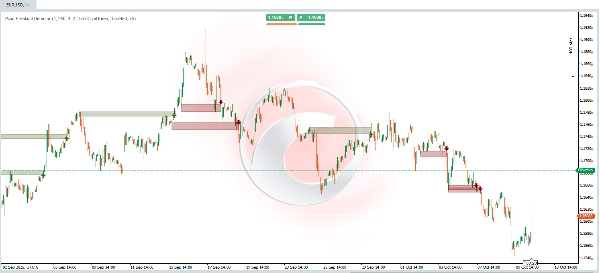
📈 **Diễn giải trực quan**
**Các thành phần trên biểu đồ:**
🟢 **Hình chữ nhật màu xanh ô liu (Đột phá tăng)**
• Vùng màu xanh lá cây đậm: Đại diện cho khu vực kháng cự đã bị vượt qua
• Viền trên và dưới: Giới hạn vùng tích lũy trước đó
• Mở rộng ngang: Hiển thị từ khi vùng được hình thành đến thời điểm đột phá
🔴 **Hình chữ nhật màu đỏ đậm (Đột phá giảm)**
• Vùng màu đỏ đậm: Đại diện cho khu vực hỗ trợ đã bị phá vỡ
• Chức năng: Giống như hình chữ nhật màu xanh nhưng dành cho các chuyển động giảm
⬆️ **Mũi tên màu xanh hướng lên**
• Vị trí: Dưới cây nến xác nhận đột phá tăng
• Ý nghĩa: Tín hiệu vào lệnh mua tiềm năng
• Diễn giải: Giá đã phá vỡ kháng cự với lực mạnh
⬇️ **Mũi tên màu đỏ hướng xuống**
• Vị trí: Trên cây nến xác nhận đột phá giảm
• Ý nghĩa: Tín hiệu vào lệnh bán tiềm năng
• Diễn giải: Giá đã phá vỡ hỗ trợ với lực mạnh
________________________________________
⚙️ **Các tham số có thể cấu hình**
1. **Độ dài phát hiện Swing (Mặc định: 4)**
• Điều khiển: Khoảng thời gian phân tích để phát hiện các pivot quan trọng
• Giá trị thấp (2-3): Phát hiện các pivot nhỏ hơn và thường xuyên hơn, tạo nhiều tín hiệu hơn nhưng có thể có nhiều tín hiệu sai
• Giá trị cao (7-10): Chỉ phát hiện các pivot lớn và đáng tin cậy hơn, tạo ít tín hiệu hơn nhưng chất lượng cao hơn
• Khuyến nghị: 4 cho giao dịch hàng ngày, 8-10 cho giao dịch swing
2. **Số thanh lịch sử vùng (Mặc định: 250)**
• Điều khiển: Số lượng nến mà chỉ báo "ghi nhớ" pivot để tạo vùng
• Giá trị thấp (30-100): Tập trung vào các vùng gần đây, phản ứng nhanh với thay đổi cấu trúc
• Giá trị cao (200-300): Xem xét các vùng lịch sử cũ hơn, hữu ích để xác định các mức dài hạn
• Khuyến nghị: 150-200 cho khung thời gian trong ngày, 250-300 cho hàng ngày hoặc cao hơn
3. **Phần trăm độ rộng vùng (Mặc định: 4%)**
• Điều khiển: Độ dày của "vùng dung sai" để nhóm các pivot thành một vùng
• Giá trị thấp (1-2%): Vùng rất chính xác, yêu cầu nhiều lần chạm gần như chính xác
• Giá trị cao (5-8%): Vùng rộng hơn, cho phép nhóm các mức gần nhau hơn
• Khuyến nghị: 2-3% cho các công cụ có biến động thấp (forex chính), 4-6% cho tiền điện tử
4. **Số lần chạm Swing tối thiểu (Mặc định: 2)**
• Điều khiển: Số lần tối thiểu giá phải "kiểm tra" vùng trước khi xem là hợp lệ
• Giá trị thấp (1-2): Nhiều tín hiệu hơn, bao gồm cả các vùng chưa được xác nhận mạnh
• Giá trị cao (3-5): Chỉ các vùng được xác nhận mạnh, ít tín hiệu hơn nhưng đáng tin cậy hơn
• Khuyến nghị: 2 cho giao dịch tích cực, 3-4 cho vị thế thận trọng hơn
________________________________________
📊 **Ví dụ thực tế**
🔵 **Ví dụ Đột phá Tăng**
**Bối cảnh trước đó:** Giá đã dao động trong vài phiên giữa $48.50 và $49.20. Trong giai đoạn tích lũy này, giá đã cố gắng vượt qua mức $49.00 ba lần khác nhau, nhưng mỗi lần đều bị từ chối, tạo ra các pivot cao gần như cùng mức.
**Hình thành vùng:** Chỉ báo tự động xác định ba pivot cao này tập trung giữa $48.90 và $49.10, tạo ra một "vùng kháng cự" rõ ràng. Vùng này được vẽ dưới dạng hình chữ nhật màu xanh ô liu bán trong suốt kéo dài ngang từ lần chạm đầu tiên đến hiện tại.
**Khoảnh khắc đột phá:** Trong phiên hiện tại, giá mở cửa ở $48.80, tăng mạnh và đóng cửa ở $49.35. Cây nến này đáp ứng tất cả các tiêu chí:
• ✅ Đóng cửa trên vùng kháng cự ($49.10)
• ✅ Là cây nến tăng mạnh (đóng cửa cao hơn nhiều so với mở cửa)
• ✅ Vượt qua đỉnh của 4 cây nến trước đó
• ✅ Vùng đã có ít nhất 2-3 lần chạm được xác nhận
**Tín hiệu tạo ra:** Một mũi tên màu xanh hướng lên xuất hiện dưới cây nến đột phá, và hình chữ nhật màu xanh ô liu "đóng lại" vào thời điểm đó, hiển thị trực quan toàn bộ cấu trúc: từ nơi kháng cự được hình thành đến nơi bị phá vỡ.
**Diễn giải của nhà giao dịch:** Đây là tín hiệu mua tiềm năng. Đột phá cho thấy người mua cuối cùng đã vượt qua kháng cự đã kìm hãm giá, và một đợt tăng bền vững hơn có thể bắt đầu. Nhà giao dịch có thể cân nhắc:
• Vào lệnh mua khi đóng nến hoặc khi giá hồi về vùng đã phá (nay là hỗ trợ)
• Đặt dừng lỗ dưới vùng ($48.70)
• Mục tiêu dựa trên chiều cao của vùng được chiếu lên trên
________________________________________
🔴 **Ví dụ Đột phá Giảm**
**Bối cảnh trước đó:** Giá đã trong giai đoạn phân phối quanh mức $102.00 gần hai tuần. Trong bốn lần khác nhau, giá cố gắng giảm xuống dưới $101.50 nhưng được người mua cứu, tạo ra các pivot thấp trong vùng rất hẹp.
**Hình thành vùng:** Chỉ báo phát hiện bốn pivot thấp này nhóm lại giữa $101.40 và $101.70, xác định một "vùng hỗ trợ" thể chế rõ ràng. Khu vực được đánh dấu bằng hình chữ nhật màu đỏ bán trong suốt ghi lại toàn bộ lịch sử phòng thủ ở mức này.
**Khoảnh khắc đột phá:** Trong một phiên biến động, giá mở cửa ở $101.80, tin xấu tác động thị trường, và giá lao dốc đóng cửa ở $100.95. Cây nến đột phá này có:
• ✅ Đóng cửa rõ ràng dưới vùng hỗ trợ ($101.40)
• ✅ Là cây nến giảm mạnh (đóng cửa thấp hơn nhiều so với mở cửa)
• ✅ Phá đáy của 4 phiên gần nhất
• ✅ Hỗ trợ đã được kiểm tra 4 lần trước đó
**Tín hiệu tạo ra:** Một mũi tên màu đỏ hướng xuống xuất hiện trên cây nến đột phá. Hình chữ nhật màu đỏ đậm được hoàn thành, ghi lại trực quan toàn bộ thời gian hình thành và điểm chính xác của sự sụp đổ hỗ trợ.
**Diễn giải của nhà giao dịch:** Đây là tín hiệu bán tiềm năng. Đột phá cho thấy người bán cuối cùng đã phá vỡ sàn hỗ trợ giá, gợi ý xu hướng giảm có thể tiếp tục. Các cân nhắc bao gồm:
• Vào lệnh bán khi đóng nến hoặc khi giá hồi về vùng đã phá (nay là kháng cự)
• Đặt dừng lỗ trên vùng ($102.00)
• Mục tiêu tính toán bằng cách chiếu chiều cao vùng xuống dưới
________________________________________
💡 **Mẹo sử dụng**
✅ **Thực hành tốt nhất:**
1. Xác nhận với khối lượng: Các đột phá thực sự thường đi kèm với sự tăng khối lượng
2. Bối cảnh xu hướng: Đột phá theo hướng xu hướng chính có xác suất thành công cao hơn
3. Thời gian chờ: Không phải tất cả tín hiệu đều phải giao dịch ngay lập tức; hãy chờ xác nhận thêm nếu cần
4. Quản lý rủi ro: Luôn sử dụng dừng lỗ dựa trên cấu trúc vùng đã phá
Tóm tắt
Key features include:
- Automatic detection of significant pivot points and consolidation zones.
- Breakout confirmation based on candle strength and price action.
- Validation requiring multiple prior touches of the zone to reduce false signals.
- Visual cues on the chart: olive green rectangles and upward arrows for bullish breakouts; dark red rectangles and downward arrows for bearish breakouts.
- Configurable parameters such as swing detection length, zone history depth, zone width, and minimum touches to tailor sensitivity and reliability.
The indicator supports various markets including Forex, cryptocurrencies, stocks, and major symbols like BTCUSD, EURUSD, GBPUSD, XAUUSD, and NAS100. It aids traders in spotting confirmed breakout opportunities, visualizing critical price levels, and managing risk with structural stop-loss placement.