
HIO RSI Multi Currency Scanner Pro
مؤشر
الإصدار 1.1، May 2026
Windows, Mac
4.7
التقييمات: 4

منذ 12/06/2025
1
المبيعات
448
التثبيتات المجانية
الوصف
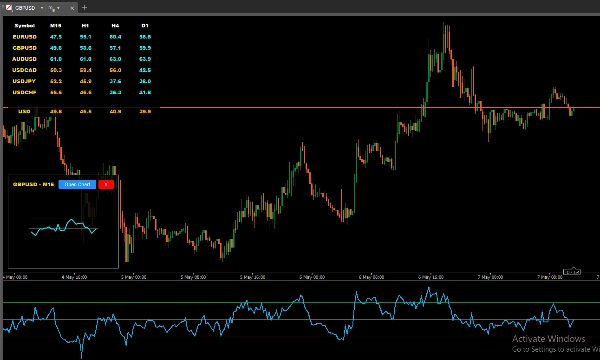
الHIO RSI Multi Currency Scanner Pro هو لوحة تحليلات مصممة لمساعدتك في مراقبة زخم السوق. بدلاً من التنقل بين مخططات متعددة، توفر هذه الأداة عرضًا موحدًا لتتبع مستويات RSI عبر رموز وأطر زمنية مختلفة في نفس الوقت. تم بناؤها لمساعدة المتداولين على تحديد ظروف السوق بكفاءة.
الميزات الرئيسية
- تكامل قوة العملة: يحسب القوة المرجحة للعملة المستهدفة بناءً على RSI والحجم عبر الأزواج المختارة.
- مخططات مصغرة تفاعلية: انقر على أي خلية بيانات لعرض مخطط مصغر فوري لتاريخ RSI دون مغادرة مساحة العمل الحالية.
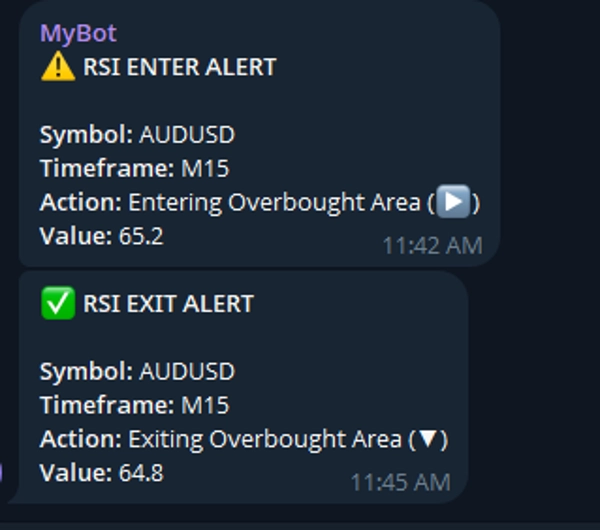
- تنبيهات ذكية: احصل على إشعارات عند دخول أو خروج RSI من مناطق قصوى محددة عبر تكامل الرسائل.
- وضعان للحساب: اختر بين Live للتتبع في الوقت الحقيقي أو BarClose للتحديثات عند إغلاق الشمعة.
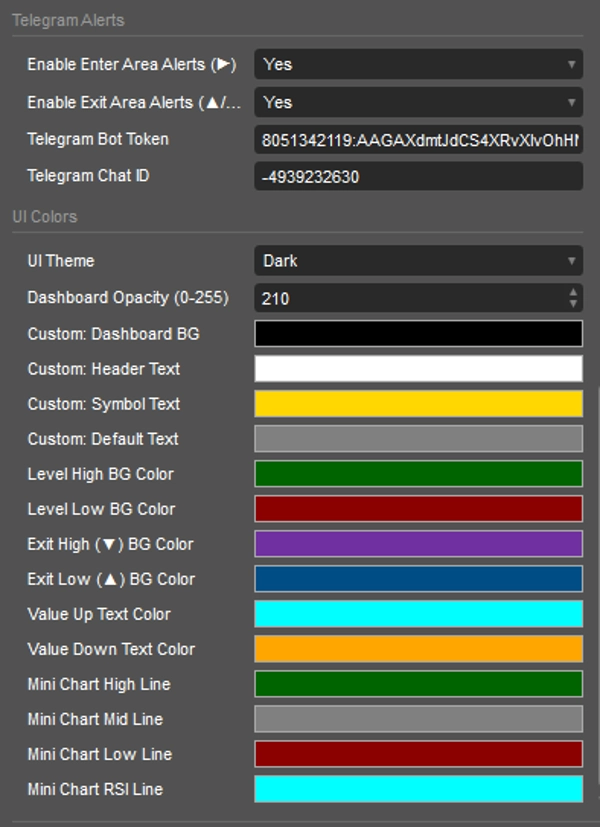
- واجهة مستخدم قابلة للتخصيص: دعم للسمات الداكنة والفاتحة والمخصصة مع قابلية ضبط الشفافية ومفتاح اختصار مخصص لتبديل رؤية اللوحة.
التنبيهات المرئية ومنطق الألوان
تستخدم اللوحة نظام ترميز لوني بديهي لمساعدتك على قراءة ظروف السوق بسرعة:
- ألوان الخلفية (المناطق):
-
- أخضر داكن / أحمر داكن: RSI حالياً في منطقة الشراء المفرط / البيع المفرط.
- بنفسجي / أزرق: RSI خرج للتو من منطقة الشراء المفرط / البيع المفرط.
- ألوان النص (الزخم): أكوا / برتقالي: قيمة RSI ترتفع / تنخفض مقارنة بالشمعة السابقة.
- مؤشرات الاتجاه: يتم تحديث النص ديناميكيًا للإشارة إلى ما إذا كان RSI يدخل أو يخرج من المناطق.
(ملاحظة: واجهة المستخدم وألوان النص قابلة للتخصيص بالكامل عبر الإعدادات)
الإعداد والمعلمات
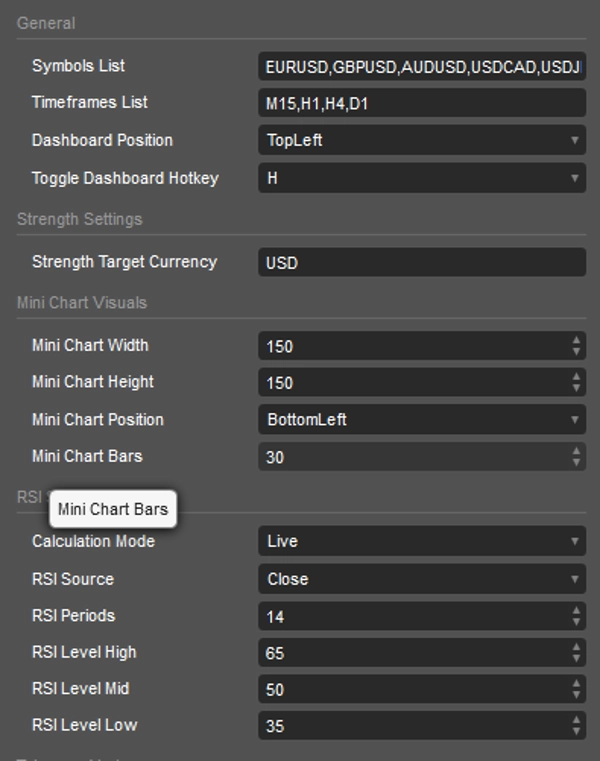
- عام: حدد قائمة الرموز وقائمة الأطر الزمنية. اضبط موقع اللوحة ومفتاح الاختصار المفضل لديك.
- جوهر RSI: اضبط فترات RSI، اختر مصدر RSI، وحدد عتبات محددة للمستويات العالية والمتوسطة والمنخفضة.
- إعدادات القوة: أدخل العملة المستهدفة لمراقبة زخمها العام.
- الإشعارات: أدخل إعداداتك لتمكين الإشعارات عن بُعد لتنبيهات الدخول أو الخروج.
ارتقِ بروتين تداولك باستخدام أداة مصممة للوضوح. الHIO RSI Multi Currency Scanner Pro مبنية لتحسين عملية مراقبة الأصول المتعددة الخاصة بك.
الملخص
ملخص الذكاء الاصطناعي
The HIO RSI Multi Currency Scanner Pro is an analytical dashboard designed for monitoring Relative Strength Index (RSI) levels across multiple symbols and timeframes simultaneously. It consolidates market momentum data into a single interface, reducing the need to switch between charts. Key features include currency strength integration, which calculates weighted strength of a target currency based on RSI and volume across selected pairs. The tool offers interactive mini-charts accessible via clickable data cells, enabling quick RSI history review without leaving the workspace. It supports smart alerts that notify users when RSI enters or exits specified extreme zones through messaging integration. Users can select between live real-time tracking or updates upon candle close with dual calculation modes. The customizable user interface supports dark, light, and custom themes, adjustable opacity, and a hotkey to toggle dashboard visibility. Visual alerts use color-coded backgrounds and text to indicate RSI zones and momentum changes, with full customization available. Setup options allow defining symbols and timeframes, adjusting RSI parameters, setting target currencies for strength monitoring, and configuring remote notifications. This tool is intended to streamline multi-asset RSI monitoring for traders seeking a comprehensive momentum overview.
ملف تعريف المؤشر
فئة المؤشر
الزخم
نوع المخرجات
التصور
الإشارات
فلتر
متطلبات البيانات
أعمدة السعر فقط
بيانات التيك
الحجم
الإشارات المدعومة
تقاطع
الانعكاس
مناقشة
تقييمات العملاء
4.7
التقييمات: 4
5 | 75 % | |
4 | 25 % | |
3 | 0 % | |
2 | 0 % | |
1 | 0 % |
تقييمات العملاء
May 20, 2026
A 12 trade note set is enough for first impressions. It keeps the review from getting sloppy.
May 18, 2026
ngl, timing feels less random and that is enough to keep testing it. M15 is enough for the first pass.
May 15, 2026
No reason to yolo this live without a few normal sessions. It needs a few bad trades in the sample too.
الأسئلة الشائعة
RSI
Volume
يتم توفير المنتجات المتاحة من خلال cTrader Store، بما في ذلك روبوتات التداول والمؤشرات والإضافات، من قبل مطوري الطرف الثالث وإتاحتها لأغراض الوصول المعلوماتي والفني فقط. cTrader Store ليس وسيطًا ولا يقدم نصائح استثمارية أو توصيات شخصية أو أي ضمان للأداء المستقبلي.
المزيد من هذا المؤلف




















السعر
منذ 12/06/2025
1
المبيعات
448
التثبيتات المجانية