Descrição
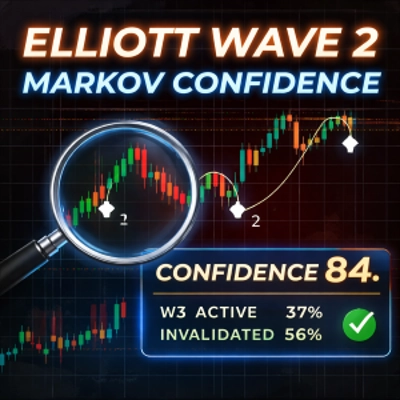
Elliott CLEAN — Wave2 + Confiança de Markov
Elliott CLEAN é um indicador analítico avançado projetado para ajudar os traders a identificar, validar e gerenciar configurações de Elliott Wave 2 usando uma combinação de estrutura de mercado e probabilidade estatística.
Em vez de prever a direção do preço, o indicador foca em transições estruturais e responde a uma pergunta mais útil:
Qual a probabilidade de uma Onda 2 evoluir para uma Onda 3 válida e sustentável — e quanta confiança o trader deve ter nesse cenário?
O Que Este Indicador Faz
O Elliott CLEAN automaticamente:
- Detecta estruturas Onda 1–Onda 2 baseadas em pivôs de oscilação
- Define gatilho, stop-loss, invalidação e alvos da Onda 3
- Acompanha resultados estruturais históricos usando um modelo de Markov de 5 estados
- Calcula probabilidades condicionais para:
-
- Ativação da Onda 3
- Invalidação da configuração
- Exaustão precoce da Onda 3
- Converte essas probabilidades em um único Índice de Confiança (0–100)
Isso permite que os traders filtre configurações de baixa qualidade, evitem over-trading e executem operações apenas quando estrutura e estatísticas estiverem alinhadas.
Principais Características
- ✅ Detecção automática da Onda 2 de Elliott
- ✅ Múltiplos modos de confirmação (Break+Hold, Break, Reclaim, Wick)
- ✅ Gatilho claro, stop-loss, invalidação e alvos projetados
- ✅ Motor de probabilidade Markov de 5 estados (baseado em eventos/oscilação, não em barras)
- ✅ Probabilidades condicionais em tempo real mostradas no gráfico
- ✅ Único Índice de Confiança (0–100) para suporte à decisão
- ✅ Design HUD limpo e não intrusivo
- ✅ Funciona em qualquer símbolo e qualquer período de tempo
O Índice de Confiança (Importante)
O Índice de Confiança não é uma taxa de acerto e não é um sinal.
É uma métrica de qualidade contextual derivada de transições estruturais históricas:
- Durante a Onda 2, o índice reflete:
-
- A probabilidade de início da Onda 3
- Ajustada pela probabilidade de falha precoce
- Durante a Onda 3, o índice reflete:
-
- A probabilidade histórica de que a Onda 3 continue sem exaustão precoce
Na prática:
- Índices baixos = estrutura fraca ou não confiável
- Índices altos = estrutura rara, mas estatisticamente robusta
Isso ajuda os traders a decidir quando manter cautela e quando deixar uma operação funcionar.
Casos de Uso Típicos
- ✔ Filtrar configurações de Elliott Wave antes da entrada
- ✔ Evitar operações marginais ou de baixa qualidade na Onda 2
- ✔ Ajustar tamanho de posição com base na confiança
- ✔ Gerenciar operações da Onda 3 com menos interferência emocional
- ✔ Apoiar trading discricionário com dados objetivos de estrutura
O indicador é especialmente útil para traders que já entendem a teoria Elliott Wave e desejam confirmação quantitativa sem automação.
Como Usar (Fluxo Básico)
- Anexe o indicador a um gráfico
- Selecione seu modo de confirmação preferido
- Espere por uma estrutura válida da Onda 2
- Observe:
-
- Gatilho, stop-loss, invalidação
- Probabilidades de Markov
- Índice de Confiança
- Decida se a configuração vale a pena negociar com base em estrutura + confiança
Notas Importantes & Aviso Legal
- Este indicador é analítico, não preditivo
- Ele não gera sinais de compra/venda
- Estatísticas estruturais passadas não garantem resultados futuros
- Trading envolve risco; os usuários são totalmente responsáveis por suas decisões
O indicador é destinado como uma ferramenta de suporte à decisão para traders discricionários.
Para Quem Este Indicador É
- Traders familiarizados com conceitos Elliott Wave
- Traders discricionários que valorizam estrutura mais que indicadores
- Traders que buscam filtros objetivos, não sistemas automatizados
- Usuários que querem contexto de probabilidade, não rótulos retrospectivos
_______________________
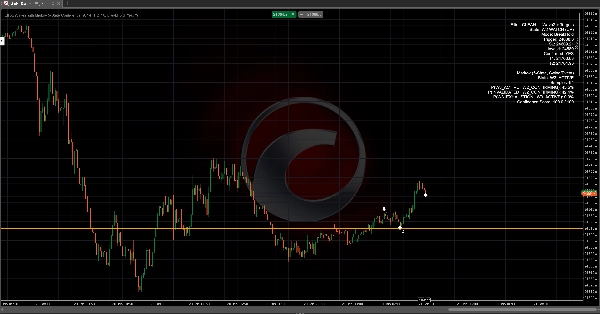
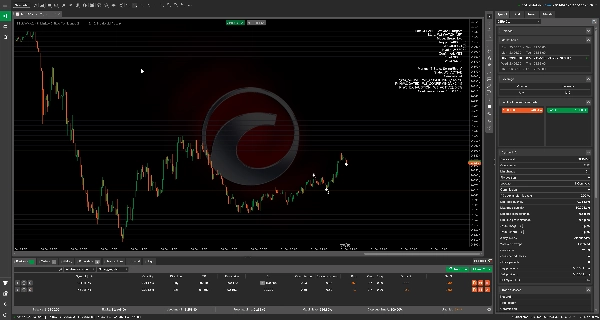
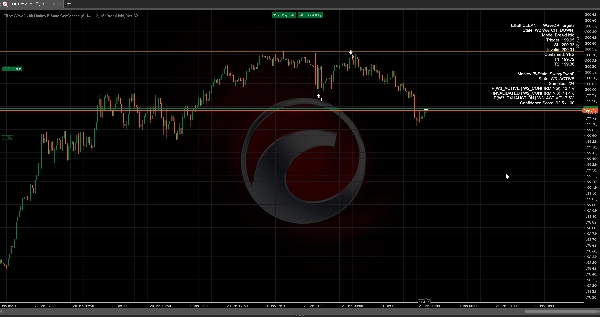
HUD & Estados
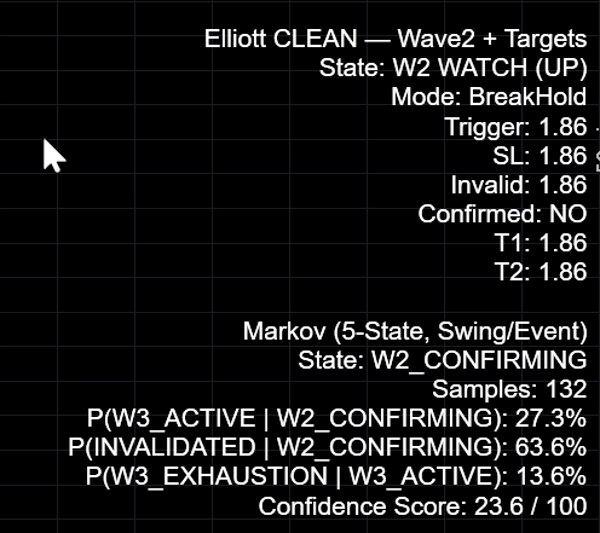
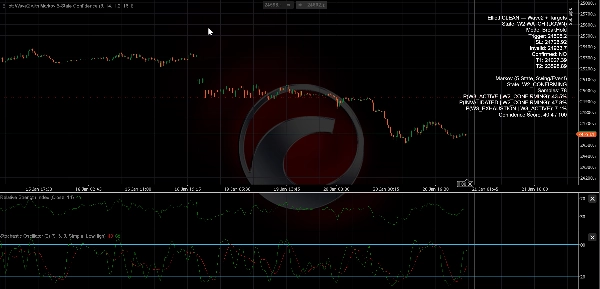
O indicador imprime níveis de estrutura e probabilidades de Markov diretamente no gráfico.
Camada principal Elliott:
- Estado: W2 WATCH (UP/DOWN) — potencial Onda 2 está presente (estrutura encontrada)
- Confirmado: SIM/NÃO — sua regra de confirmação selecionada foi acionada
- Gatilho — preço do nível deve romper/recuperar (depende do modo)
- SL — nível de stop protetor sugerido (depende do modo SL)
- Inválido — nível de invalidação estrutural (início da Onda 1)
- T1/T2 — projeções da Onda 3 usando multiplicadores
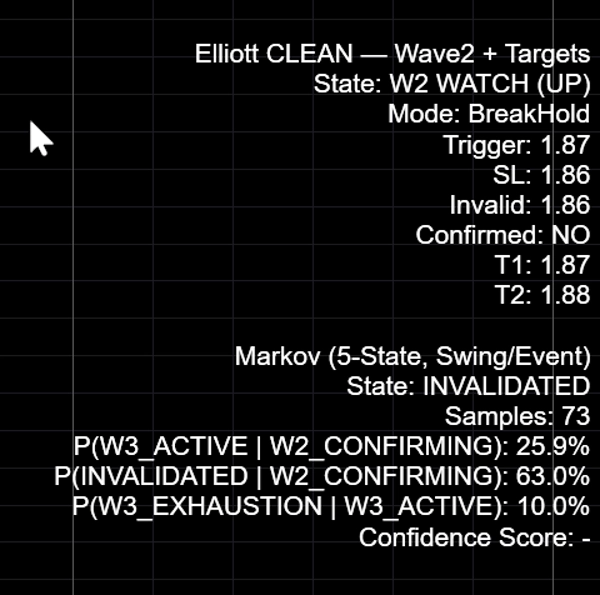
Camada Markov:
- Estado — estado atual de Markov (ex.,
W2_CONFIRMING,W3_ACTIVE,INVALIDATED) - Amostras — contagem histórica usada para probabilidades
- P(W3_ACTIVE | W2_CONFIRMING) — chance da Onda 3 ativar a partir da fase da Onda 2
- P(INVALIDATED | W2_CONFIRMING) — chance da configuração falhar durante a fase da Onda 2
- P(W3_EXHAUSTION | W3_ACTIVE) — chance da Onda 3 falhar cedo uma vez ativa
Índice de Confiança (0–100)
O Índice de Confiança não é uma taxa de acerto e não é uma garantia. É uma métrica de qualidade derivada de transições estruturais históricas.
Como o índice é usado:
- Durante
W2_CONFIRMING, o índice reflete “probabilidade de ativação” ajustada pelo risco de falha precoce. - Durante
W3_ACTIVE, o índice reflete “robustez de continuação” (baixo risco de exaustão precoce).
Sempre interprete o índice junto com: (1) clareza da estrutura, (2) distância de invalidação e (3) tamanho da amostra.
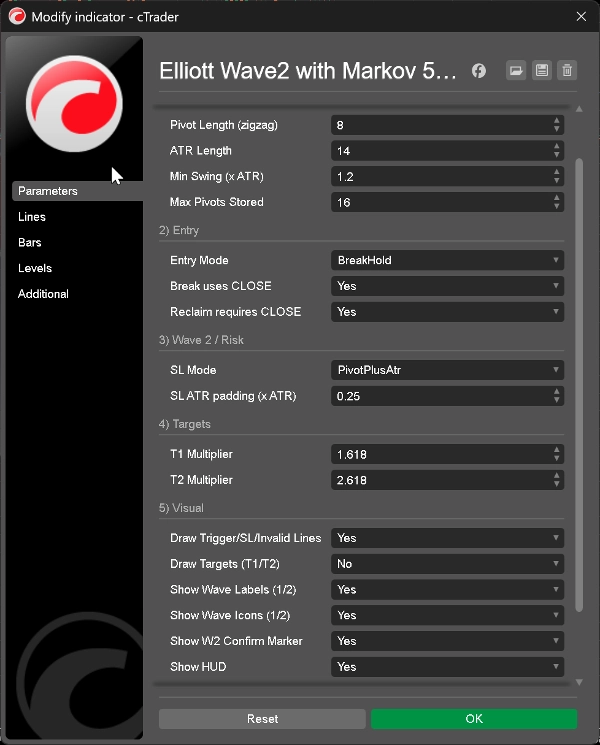
Entradas (O que fazem)
1) Pivô / Estrutura
- Comprimento do Pivô (zigzag): Controla a sensibilidade da oscilação. Maior = menos oscilações, estrutura mais limpa.
- Comprimento ATR: Janela ATR usada para filtragem de oscilação e preenchimento opcional de SL.
- Oscilação Mínima (×ATR): Tamanho mínimo da oscilação para aceitar um pivô (filtra ruído).
- Máximo de Pivôs Armazenados: Limita o histórico de oscilação armazenado (desempenho & estabilidade).
2) Entrada
- Modo de Entrada: Escolha o estilo de confirmação:
-
BreakHold— mais seguro: rompe e mantém além do gatilhoBreak— mais rápido: rompe o gatilho uma vezReclaim— comportamento de varredura + recuperaçãoWick— agressivo: pavio através do gatilho
- Break usa CLOSE: Usa fechamento em vez de pavio para lógica de rompimento (recomendado).
- Reclaim requer CLOSE: Requer fechamento do lado correto após varredura.
3) Onda 2 / Risco
- Modo SL: Determina a linha base para colocação do stop.
- Preenchimento SL ATR (×ATR): Buffer extra ao usar stop baseado em ATR.
4) Alvos
- Multiplicador T1 / Multiplicador T2: Multiplicadores de projeção da Onda 3 (padrões: 1.618 e 2.618).
5) Visual
- Desenhar Linhas de Gatilho/SL/Inválido: Mostrar/ocultar níveis horizontais principais.
- Desenhar Alvos: Linhas de alvo opcionais (menos “limpo”).
- Mostrar Rótulos / Ícones da Onda: Exibir marcadores de onda (1/2).
- Mostrar Marcador de Confirmação W2: Mostra marcador de confirmação.
- Mostrar HUD: Mostrar/ocultar todo o HUD.
Como usar:
- Escaneie múltiplos mercados, depois foque apenas em ambientes estruturais de maior qualidade.
- Use índice + tamanho da amostra para decidir quando uma configuração vale o tempo e o risco.
FAQ
Isso funciona em todos os símbolos e períodos de tempo?
Sim. É uma abordagem baseada em estrutura. Resultados e probabilidades variam conforme comportamento e volatilidade do mercado.
O Índice de Confiança é uma taxa de acerto?
Não. É uma pontuação de qualidade estrutural derivada de transições históricas de estado (modelo Markov). Não garante resultados.
Por que o índice é frequentemente baixo durante a Onda 2?
Porque a ativação da Onda 3 é seletiva. Muitos candidatos a Onda 2 falham ou oscilam. O indicador é projetado para filtrar esses casos.
E quanto ao tamanho pequeno da amostra?
Trate as probabilidades como menos estáveis quando o tamanho da amostra é pequeno. Use o índice como contexto, não como certeza.
Aviso de Risco
Trading envolve risco e pode não ser adequado para todos os investidores. Desempenho passado e probabilidade histórica não garantem resultados futuros. Este indicador fornece apenas informações analíticas e não constitui aconselhamento de investimento ou recomendação para comprar ou vender qualquer instrumento. Você é responsável por suas próprias decisões, gerenciamento de risco e conformidade com as regulamentações locais.
Elliott Wave, Estrutura de Mercado, Análise Técnica, Probabilidade, Análise Estatística, Swing Trading, Gestão de Risco, Suporte à Decisão
Resumo
Avaliações de clientes
5 | 100 % | |
4 | 0 % | |
3 | 0 % | |
2 | 0 % | |
1 | 0 % |


