

Description
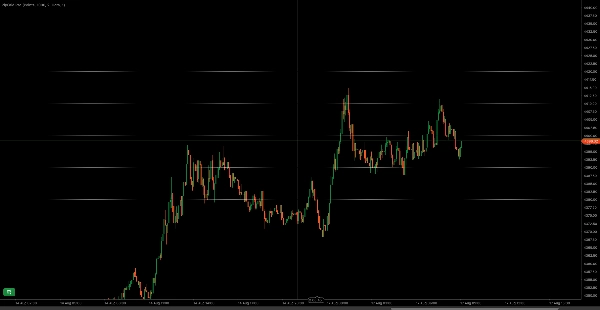
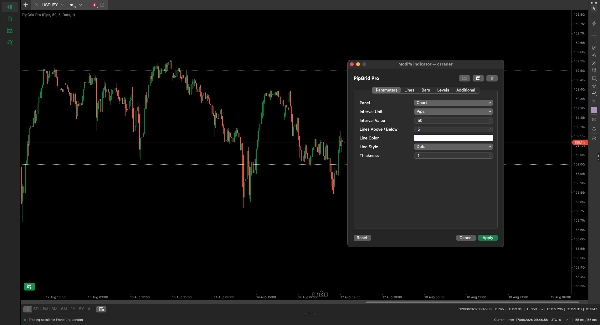
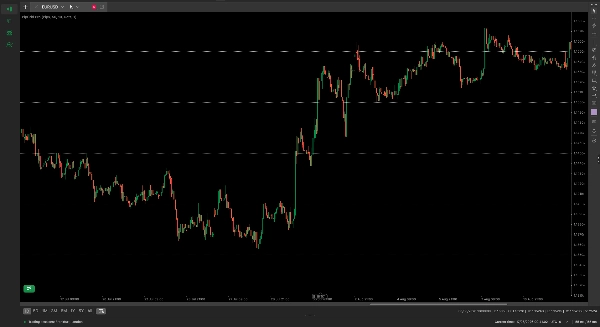
PipGrid Pro trace automatiquement des niveaux de prix horizontaux propres et non intrusifs calibrés selon votre stratégie de trading exacte sans encombrer vos graphiques.
Le flux d'ordres institutionnels, les placements de stops et les objectifs de prise de bénéfices se regroupent systématiquement autour de nombres entiers psychologiques et de grands chiffres. Alors que les scripts génériques échouent lors du changement d'instruments, traçant souvent des lignes à des milliers de pips sur l'Or ou les Cryptomonnaies, PipGrid Pro lit nativement les spécifications de ticks et pips du courtier pour offrir un espacement des niveaux mathématiquement précis sur n'importe quel symbole.
Fonctionnalités clés
- Calibration universelle des symboles : Basculez facilement entre Pips, Points du courtier, et Unités de prix pour un calibrage précis sur le Forex, les Métaux (XAUUSD), les Indices et les Cryptomonnaies.
- Espace de noms sécurisé pour les objets : Trace exclusivement sous l'identifiant isolé RNL_ . Il ne remplacera, modifiera ni ne supprimera jamais vos tracés manuels, retracements de Fibonacci ou indicateurs tiers.
- Suivi dynamique de la plage : Recentre et met automatiquement à jour la fenêtre de la grille visible au fur et à mesure que le prix du marché évolue.
- Personnalisation visuelle complète : Ajustez les couleurs des lignes, les styles (Solide, Points, Lignes, LignesPoints) et l'épaisseur pour correspondre à n'importe quel thème de graphique clair ou sombre.
- Exécution légère : Aucun retard de performance ; les calculs s'exécutent strictement lors des vérifications des limites des barres en direct.
Paramètres
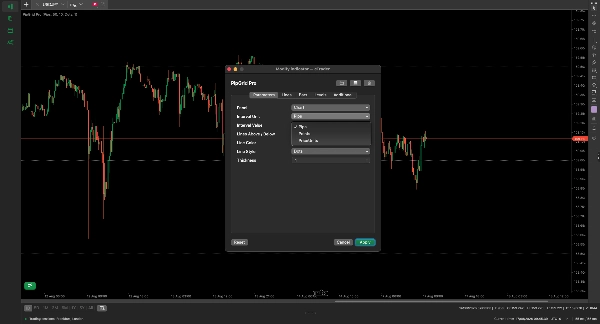
- Unité d'intervalle (Par défaut : Pips) — Sélectionnez votre mode de calcul entre Pips, Points ou Unités de prix pour un calibrage exact de l'actif.
- Valeur d'intervalle (Par défaut : 10.0) — La distance exacte entre chaque ligne horizontale de la grille.
- Lignes au-dessus / en dessous (Par défaut : 20) — Le nombre total de niveaux de grille tracés au-dessus et en dessous du prix actuel du marché.
- Couleur de la ligne (Par défaut : Gris) — Couleur visuelle des lignes de la grille tracées.
- Style de ligne (Par défaut : Points) — Motif visuel des lignes (Solide, Points, Lignes, LignesPoints).
- Épaisseur (Par défaut : 1) — Épaisseur du trait des lignes horizontales (valeurs de 1 à 5).
Configurations recommandées par actif
- Forex (EURUSD, GBPUSD) : Réglez l'unité sur Pips avec un intervalle de 50 ou 100 pour des chiffres entiers institutionnels.
- Or (XAUUSD) : Réglez l'unité sur Pips avec un intervalle de 10 ou 50 pour des niveaux propres à 1,00 $ et 5,00 $.
- Indices (US30, NAS100) : Réglez l'unité sur Points avec un intervalle de 100 ou 500 pour les niveaux clés des jalons des indices.
- Crypto (BTCUSD, ETHUSD) : Réglez l'unité sur PriceUnits avec un intervalle de 1000 ou 5000 pour les principales barrières psychologiques.
Résumé
Key functionalities include dynamic range tracking that recenters the grid as price moves, a safe object namespace that prevents interference with manual drawings or other indicators, and full visual customization options for line color, style, and thickness. PipGrid Pro operates efficiently with zero performance lag by executing calculations only on live bar boundaries.
Users can configure parameters such as interval unit and value, number of lines above and below the current price, and visual styles. Recommended settings are provided for different asset classes to highlight institutional order flow clusters and key support/resistance levels. This tool is intended for traders seeking clean, non-intrusive visualization of key price levels that reflect market psychology and institutional activity.

















![Logo de "High-Low Divergence [Iridio Capital]"](https://cdn.ctrader.com/image/webp/10a9e91b-243a-43f6-bbfe-7376bad5a214_61554)