
Tracking Performance by Quantara
Indicador
44 transferências
Versão 1.0, Feb 2026
Windows, Mac
Desde 29/01/2026
44
Instalações gratuitas
Descrição
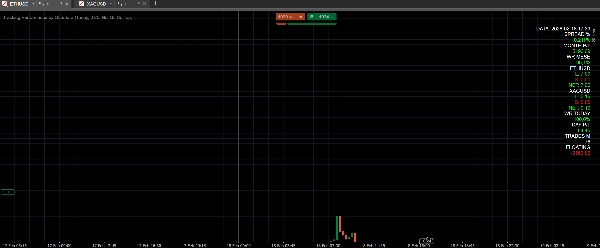
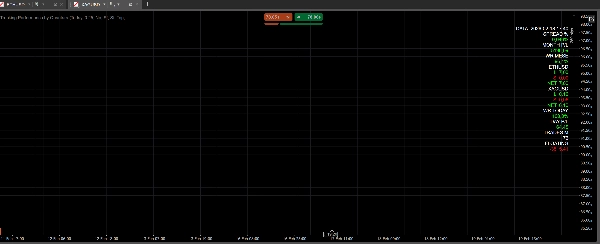
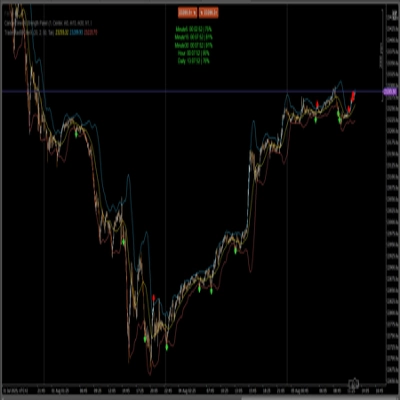
Tracking Perfromance by Quantara é um indicador de painel que exibe métricas de desempenho em tempo real e exposição por ativo.
Ele mostra: P/L mensal e diário, taxa de vitória mensal e diária, contagem mensal de negociações, P/L flutuante, spread em porcentagem e long/short/net para cada ativo aberto.
Todos os valores são codificados por cores para leitura rápida (P/L positivo/negativo, limites de taxa de vitória, long verde, short vermelho).
O que ele calcula/exibe
- Spread % (com diferentes limites para metais e criptomoedas)
- P/L mensal e diário
- Taxa de vitória mensal e diária
- Contagem mensal de negociações
- P/L flutuante
- Exposição por ativo (long / short / net)
Instrumentos/intervalos recomendados
- Funciona em qualquer instrumento e qualquer intervalo de tempo
- Sugerido nos gráficos principais (M15–H4) para monitoramento diário
Como usar
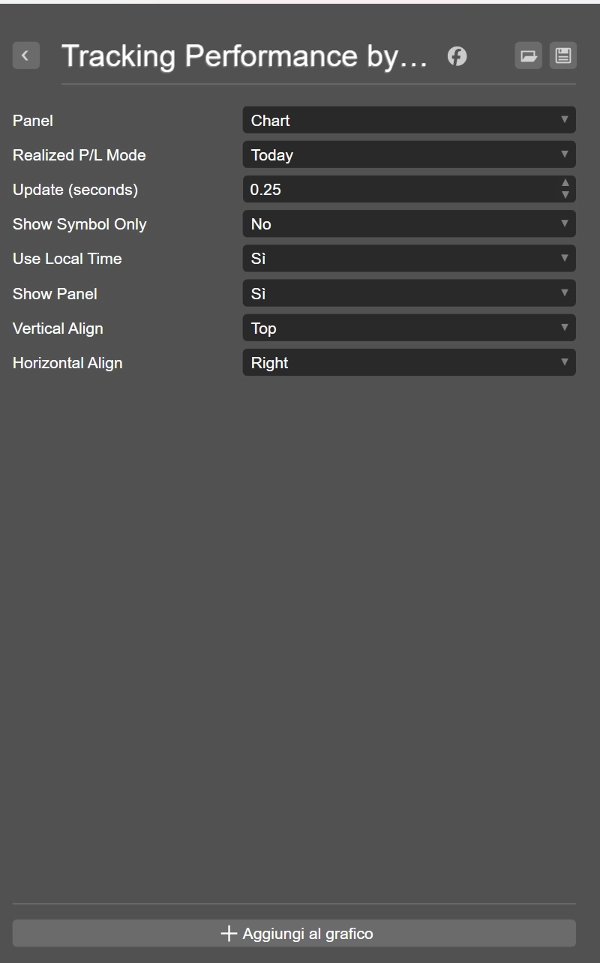
- Adicione o indicador a um gráfico
- Defina o intervalo de atualização (Update seconds)
- Use Show Panel para alternar a visibilidade
- Use “Show Symbol Only” para filtrar pelo símbolo do gráfico
- Use “Use Local Time” para aplicar filtros de horário local
Parâmetros chave
- Update (seconds): frequência de atualização
- Show Symbol Only: exibir apenas o símbolo do gráfico
- Use Local Time: usar horário local para filtros
- Show Panel: mostrar/ocultar o painel
- Vertical/Horizontal Align: posicionamento do painel
Casos de uso
- Verificação rápida da exposição líquida por ativo
- Acompanhamento diário e mensal de desempenho
- Monitoramento da taxa de vitória para qualidade operacional
- Monitoramento do % de spread para metais e criptomoedas
Aviso legal
Negociar envolve riscos. Desempenho passado não garante resultados futuros.
Resumo
AI summary
Tracking Performance by Quantara is a dashboard indicator designed for real-time monitoring of trading performance across multiple assets. It provides key metrics including monthly and daily profit and loss (P/L), win rate, trade count, floating P/L, and spread percentage, with specific thresholds for metals and cryptocurrencies. The indicator also displays per-asset exposure categorized as long, short, or net positions. All values are dynamically color-coded to facilitate quick interpretation, highlighting positive/negative P/L, win-rate levels, and position types.
This tool is compatible with any trading instrument and timeframe, with a recommendation for use on main charts ranging from 15-minute to 4-hour intervals for daily performance tracking. Users can customize update frequency, toggle panel visibility, filter data to the current chart symbol, and apply local time settings. The indicator supports quick assessment of net exposure, daily and monthly performance, win-rate monitoring, and spread percentage analysis for metals and crypto markets.
Key parameters include update interval, symbol filtering, local time usage, panel display options, and panel alignment. This indicator is applicable across Forex, Indices, Commodities, Crypto, and Stocks markets.
This tool is compatible with any trading instrument and timeframe, with a recommendation for use on main charts ranging from 15-minute to 4-hour intervals for daily performance tracking. Users can customize update frequency, toggle panel visibility, filter data to the current chart symbol, and apply local time settings. The indicator supports quick assessment of net exposure, daily and monthly performance, win-rate monitoring, and spread percentage analysis for metals and crypto markets.
Key parameters include update interval, symbol filtering, local time usage, panel display options, and panel alignment. This indicator is applicable across Forex, Indices, Commodities, Crypto, and Stocks markets.
Perfil do indicador
Avaliações de clientes
0.0
Avaliações: 0
Avaliações de clientes
Ainda não há avaliações para este produto. Já o experimentou? Seja o primeiro a contar a outras pessoas!
Conversa
Perguntas frequentes
Forex
Indices
Commodities
Crypto
Stocks
Os produtos disponíveis através da cTrader Store, incluindo bots de negociação, indicadores e plugins, são fornecidos por programadores terceiros e são disponibilizados apenas para fins informativos e de acesso técnico. A cTrader Store não é um corretor e não fornece aconselhamento em matéria de investimento, recomendações pessoais ou qualquer garantia de desempenho no futuro.










![Logótipo de "High-Low Divergence [Iridio Capital]"](https://cdn.ctrader.com/image/webp/10a9e91b-243a-43f6-bbfe-7376bad5a214_61554)


Preço
Desde 29/01/2026
44
Instalações gratuitas