
SymbolTFOverlay
Indikator
119 downloads
Version 1.0, Sep 2025
Windows, Mac
Beschreibung
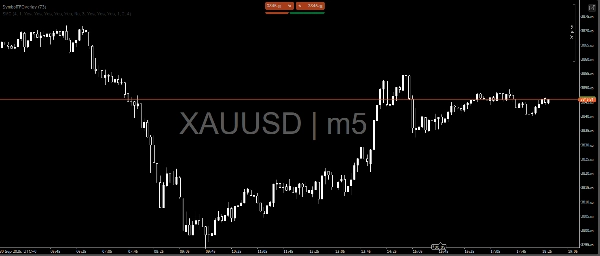
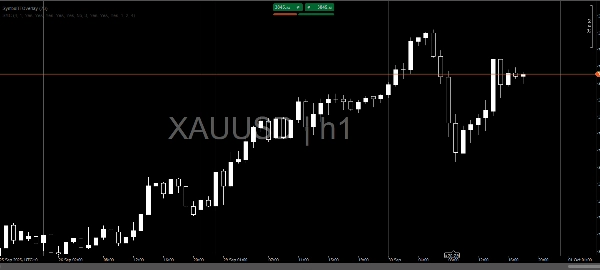
Das SymbolTFOverlay ist ein benutzerdefinierter Indikator für die cTrader-Plattform, der entwickelt wurde, um das aktuelle Symbol (z. B. EURUSD) und den Zeitrahmen (z. B. H1) als halbtransparenten Text-Overlay auf dem Chart anzuzeigen. Dieser Indikator verbessert die Lesbarkeit des Charts, indem er eine klare, zentralisierte visuelle Referenz für wichtige Marktinformationen bietet. Hauptmerkmale:
- Dynamische Textanzeige: Zeigt das Symbol und den Zeitrahmen (z. B. „EURUSD | H1“) in der Mitte des sichtbaren Chartbereichs an.
- Automatische Aktualisierungen: Aktualisiert den Text bei jeder neuen Kerze, um sicherzustellen, dass er zentriert bleibt.
- Anpassbares Erscheinungsbild: Schriftgröße, Farbe und Transparenz des Textes können frei angepasst werden.
- Effiziente Überwachung: Verwendet einen Timer (Prüfung alle 2 Sekunden), um Änderungen im sichtbaren Chartbereich wie Zoom oder Scrollen zu erkennen und so eine nahtlose Text-Neupositionierung zu ermöglichen.
- Robuste Validierung: Enthält Prüfungen, um Fehler durch ungültige Indizes oder Preisniveaus zu vermeiden und so eine zuverlässige Leistung unter verschiedenen Marktbedingungen zu gewährleisten.
- Overlay-Design: Rendert den Text direkt auf dem Chart, ohne diesen zu überladen, und sorgt so für ein sauberes visuelles Erlebnis.
Der Indikator ist ideal für Trader, die schnellen Zugriff auf Symbol- und Zeitrahmeninformationen benötigen, während sie Charts analysieren, mit automatischen Anpassungen zur optimalen Sichtbarkeit bei dynamischen Chart-Interaktionen.
Zusammenfassung
KI-Zusammenfassung
SymbolTFOverlay is a custom indicator for the cTrader platform that displays the current trading symbol and timeframe as a semi-transparent text overlay centered on the chart. It dynamically updates the displayed text with each new bar formation to ensure accuracy. The indicator automatically repositions the overlay during chart interactions such as zooming or scrolling by checking the visible area every two seconds. Users can customize the font size, color, and transparency of the text to suit their preferences. Built-in validation prevents errors from invalid data, supporting reliable performance across various market conditions. The overlay design integrates the information directly on the chart without cluttering the visual space, enhancing chart readability. This indicator supports multiple market types including Forex, Indices, Commodities, Crypto, and Stocks. It is intended for traders who require immediate, clear reference to the current symbol and timeframe during technical analysis.
Indikatorprofil
Kundenbewertungen
0.0
Bewertungen: 0
Kundenbewertungen
Bisher gibt es keine Bewertungen für dieses Produkt. Haben Sie es schon ausprobiert? Dann können Sie die erste Person sein, die andere darüber informiert!
Diskussion
Häufig gestellte Fragen (FAQ)
Forex
Indices
Commodities
Crypto
Stocks
Über den cTrader Store verfügbare Produkte, einschließlich Handelsbots, Indikatoren und Plugins, werden von externen Entwicklern bereitgestellt und nur zu Informations- und technischen Zugriffszwecken verfügbar gemacht. cTrader Store ist kein Broker und erbringt keine Anlageberatung, persönlichen Empfehlungen oder eine Garantie für zukünftige Performance.


Preis
Seit 26/09/2025
119
Kostenlose Installationen