Beschreibung
SCHWUNGDETEKTOR
Strukturelle Schwungpunkte + Fibonacci-Retracement + RSI
--------------------------------------------------
KOSTENLOSER INDIKATOR
Identifizieren Sie strukturelle Schwünge. Sehen Sie den Trend. Handeln Sie mit Übereinstimmung.
--------------------------------------------------
WAS DIESER INDIKATOR TUT
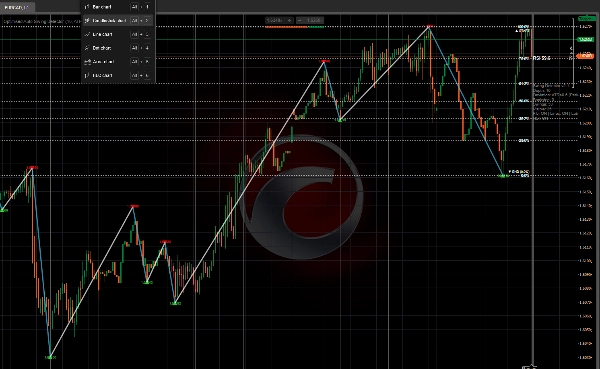
Der Schwungdetektor identifiziert strukturelle Schwunghochs und -tiefs mittels lokaler Extrempunkterkennung mit konfigurierbarer Tiefe und automatischer Abweichungsfilterung.
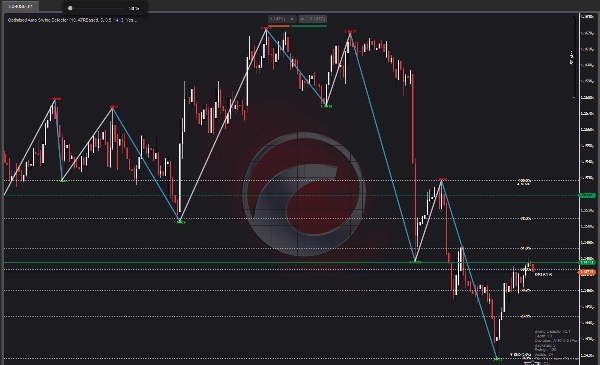
Anschließend verbindet er Schwünge mit Trendlinien, legt Standard-Fibonacci-Retracement-Level darüber und zeigt den aktuellen RSI-Wert in der Nähe des Preises an.
--------------------------------------------------
HAUPTMERKMALE
- Erkennung von Schwungpunkten (konfigurierbare Tiefe)
- AUTO-ABWEICHUNG: ATR-basierte Filterung passt sich jedem Zeitrahmen an
- Fester Pip-Abweichungsmodus (für manuelle Steuerung)
- Schwung-Trendlinien (Aufschwung blau, Abschwung orange)
- FIBONACCI-RETRACEMENT (0, 23,6, 38,2, 50, 61,8, 78,6, 100 Prozent)
- RSI-WERT-OVERLAY (aktueller RSI nahe dem Preis)
- Anpassbare Farben
- Leistungsoptimiert (maximale zu zeichnende Balken)
--------------------------------------------------
AUTO-ABWEICHUNG - HAUPTMERKMAL
Zwei Abweichungsmodi verfügbar:
- FESTE PIPS: Legen Sie einen festen minimalen Pip-Abstand zwischen Schwüngen fest
- ATR-BASIERT (AUTO): Dynamische Abweichung basierend auf der aktuellen Volatilität
WARUM AUTO-ABWEICHUNG WICHTIG IST:
- M1 bis M5: Enge Abweichung (erfasst kleine Schwünge)
- H1 bis H4: Mittlere Abweichung (erfasst Struktur)
- D1 bis MN1: Weite Abweichung (erfasst große Schwünge)
Der Indikator passt sich automatisch an den von Ihnen verwendeten Zeitrahmen an. Keine manuelle Anpassung erforderlich beim Wechseln der Charts.
Dies macht den Schwungdetektor auf ALLEN Zeitrahmen nutzbar – von 1-Minuten- bis zu Monatscharts.
--------------------------------------------------
FIBONACCI-RETRACEMENT - HAUPTMERKMAL
Für den zuletzt abgeschlossenen Schwung zeichnet der Indikator:
- 0,0 Prozent (Beginn des Schwungs)
- 23,6 Prozent
- 38,2 Prozent
- 50,0 Prozent
- 61,8 Prozent
- 78,6 Prozent
- 100,0 Prozent (Ende des Schwungs)
Schalten Sie Linien und Beschriftungen ein/aus. Alle Levels sind farblich codiert für schnelle visuelle Orientierung.
--------------------------------------------------
RSI-OVERLAY - HAUPTMERKMAL
Der aktuelle RSI-Wert wird nahe dem Preis mit Farbcode angezeigt:
- ROT: RSI über 70 (überkauft)
- GRÜN: RSI unter 30 (überverkauft)
- WEISS: RSI zwischen 30 und 70 (neutral)
Dies bietet sofortigen Momentum-Kontext, ohne ein separates RSI-Fenster öffnen zu müssen.
--------------------------------------------------
VISUELLE ELEMENTE
- Rote Abwärtspfeile = Schwunghochs
- Grüne Aufwärtspfeile = Schwungtiefs
- Blaue Linien = Aufschwung (Tief zu Hoch)
- Orange Linien = Abschwung (Hoch zu Tief)
- Goldene horizontale Linien = Fibonacci-Level
- Weiße Beschriftungen = Fibonacci-Prozentsätze
- RSI-Wert = Aktueller RSI nahe dem Preis
- Info-Panel = Tiefe, Abweichung, Backstep, Schwunganzahl
--------------------------------------------------
PARAMETERÜBERSICHT
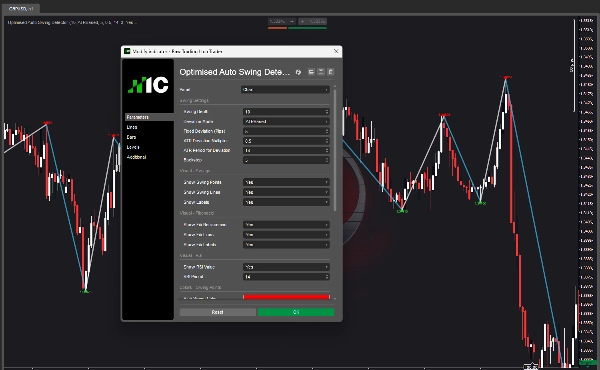
SCHWUNGEINSTELLUNGEN:
- Schwungtiefe: Wie viele Balken für lokale Extrema geprüft werden
- Abweichungsmodus: Feste Pips oder ATR-basiert (Auto)
- Feste Abweichung: Minimale Pip-Distanz zwischen Schwüngen
- ATR-Abweichungs-Multiplikator: Multiplikator für ATR-basierte Abweichung
- ATR-Periode: Periode für ATR-Berechnung
- Backstep: Minimale Balken zwischen Schwüngen
VISUELL - SCHWÜNGE:
- Schwungpunkte anzeigen: Pfeile ein-/ausschalten
- Schwunglinien anzeigen: Trendlinien ein-/ausschalten
- Beschriftungen anzeigen: Preisbeschriftungen ein-/ausschalten
VISUELL - FIBONACCI:
- Fib Retracement anzeigen: Fibonacci-Overlay ein-/ausschalten
- Fib Linien anzeigen: Horizontale Linien ein-/ausschalten
- Fib Beschriftungen anzeigen: Prozentbeschriftungen ein-/ausschalten
VISUELL - RSI:
- RSI-Wert anzeigen: RSI-Overlay ein-/ausschalten
- RSI-Periode: Periode für RSI-Berechnung
FARBEN:
- Farbe für Hoch-Schwung
- Farbe für Tief-Schwung
- Farbe der Aufschwunglinie
- Farbe der Abschwunglinie
- Farbe der Fib-Linien
- Farbe des Fib-Textes
- Farbe der RSI-Beschriftung
LEISTUNG:
- Max. zu zeichnende Balken: Begrenzung der Zeichnung für schnellere Leistung
--------------------------------------------------
ANWENDUNGSFÄLLE
- Identifizieren Sie strukturelle Schwungpunkte in JEDEM Zeitrahmen
- Zeichnen Sie Trendlinien zwischen Schwüngen
- Verwenden Sie Fibonacci-Level für Einstiege, Ausstiege und Gewinnziele
- Bestätigen Sie Trades mit RSI-Übereinstimmung
- Verstehen Sie die Marktstruktur auf einen Blick
- Wechseln Sie Zeitrahmen ohne Parameteranpassung (Auto-Abweichung)
--------------------------------------------------
ZEITRAHMEN-NUTZBARKEIT
Mit aktivierter AUTO-ABWEICHUNG funktioniert der Indikator in:
- M1, M5, M15 (Scalping)
- M30, H1, H4 (Daytrading)
- D1 (Swingtrading)
- W1, MN1 (Positionstrading)
Ein Indikator. Alle Zeitrahmen.
--------------------------------------------------
UPGRADE ZU STRUKTURELLEN HEAT ZONES
Dieser kostenlose Indikator zeigt Ihnen Schwünge und Struktur.
Structural Heat Zones geht weiter – es kartiert Beteiligungsintensität, Akzeptanz vs. Ablehnung und Marktengagement über mehrere Zonen hinweg.
Suchen Sie nach Structural Heat Zones im cTrader Store.
--------------------------------------------------
UPGRADE ZU INVICTUS EA
Invictus EA verwendet dieselbe strukturelle Technologie zur Ausführung automatisierter Trades.
Suchen Sie nach Invictus im cTrader Store.
--------------------------------------------------
TECHNISCHE HINWEISE
- Overlay-Indikator
- Funktioniert auf jedem Zeitrahmen und Symbol
- Kein Repainting (Schwünge sind historisch)
- Leistungsoptimiert
--------------------------------------------------
SUPPORT
Lebenslange Updates inklusive.
FÜR MEHR INFORMATIONEN – Klicken Sie unten auf das Entwicklerprofil.
Zusammenfassung
Kundenbewertungen
5 | 100 % | |
4 | 0 % | |
3 | 0 % | |
2 | 0 % | |
1 | 0 % |