present
Registrieren Sie sich und erhalten Sie $50 Rabatt auf Ihren ersten Kauf
Trading product for Liquidity & Structure (SMC) Free Indikator Fair Value Gap BOS, image 1
Liquidity & Structure (SMC) Free
Indikator
490 downloads
Version 2.0, Aug 2026
Windows, Mac
5.0
Bewertungen: 1
Trading product for Liquidity & Structure (SMC) Free Indikator Fair Value Gap BOS, image 2
Trading product for Liquidity & Structure (SMC) Free Indikator Fair Value Gap BOS, image 3
30.48M
Gehandeltes Volumen
12.32K
Pip-Gewinn
25
Verkäufe
2.1K
Kostenlose Installationen

Beschreibung

Vollständige Dokumentation, jede Einstellung und alle Daten ausführlicher auf unserer Website: realbacktesting.com


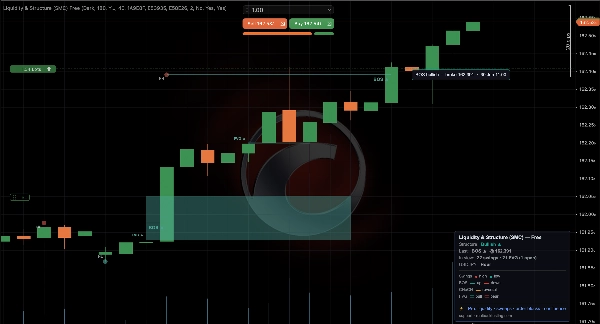
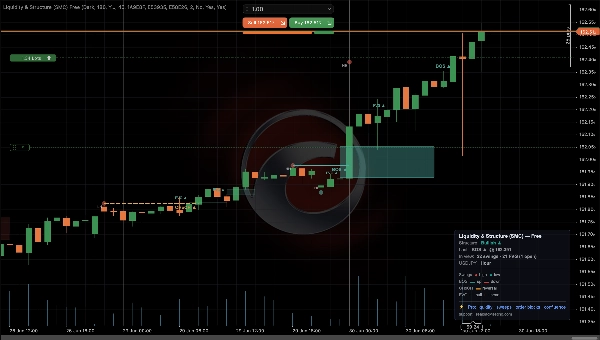
Liquidität & Struktur (SMC) (Kostenlos) — Smart-Money-Konzepte auf Ihrem cTrader-Chart. Kein Repaint, und es misst sich selbst.


Lies das Smart Money. Dieser kostenlose Indikator zeichnet das gesamte Kernbild des SMC — Struktur, Lücken, Orderblöcke, Liquidität und Premium/Rabatt — in einer sauberen Überlagerung, die nie neu zeichnet. Und dann macht er etwas, was kein anderer Indikator in dieser Kategorie tut: Er zählt, an IHREN Bars, wie oft der Preis tatsächlich auf die von ihm gezeichneten Zonen reagiert hat.


WAS SIE BEKOMMEN (KOSTENLOS)

✅ Marktstruktur — BOS / CHoCH, automatisch beschriftet, mit HH / HL / LH / LL

✅ Fair-Value-Lücken (FVG) — gezeichnet, Füllzustand verfolgt, mit Mindestgrößenfilter

✅ Orderblöcke — bullishe / bearishe Zonen, mit Verschiebungs- und Körperqualitätsfiltern

✅ Liquidität — gleiche Hochs / Tiefs und Stop-Hunt-Sweeps

✅ Premium / Rabatt — wo der Preis innerhalb der aktuellen Schwankungsbreite liegt

✅ Gemessene Zuverlässigkeit — die Trefferquote der gezeichneten Zonen auf Ihrem eigenen Chart

✅ Sitzungen nach der eigenen Uhr jedes Marktes — die Sommerzeitumstellung wird für Sie angewendet

✅ Kein Repaint — jedes Element stammt von geschlossenen Kerzen

✅ Konfigurierbare Farben, Breiten, Deckkraft und welche Elemente gezeichnet werden


GEMESSEN, NICHT VERSPROCHEN

Das Panel zeigt etwas wie „Orderblöcke hielten 65 % (n=258)“ an. Das ist Ihr Symbol, Ihr Zeitrahmen, Ihre Schwellenwerte — berechnet an Ihren Bars, von Ihnen reproduzierbar. Es ist eine Zählung der Preisreaktionen auf geschlossenen Kerzen, kein Strategieresultat: keine Einstiege, keine Stops, keine Kosten. Wir zeigen Ihnen lieber eine Zahl, die Sie überprüfen können, als eine Behauptung, die Sie glauben müssen.


⭐ UPGRADE ZU PRO (29 $, einmalig) — das fügt es tatsächlich hinzu:

▸ Die vollständige Sitzungsaufteilung — drei Sitzungen, Ihre eigenen Fenster und die Uhrzeit, in der jede gelesen wird

▸ Auto-Kalibrierung — es testet 12 Einstellungen und meldet die beste für IHR Symbol, neben dem Median des Tests

▸ FVG-Einstieg verglichen — Einstieg am Rand der Lücke gegenüber dem Warten auf 50 %

▸ Berührungsverzögerung — wie lange es dauert, bis ein Level getroffen wird, damit Sie wissen, wann Sie aufgeben sollten

▸ Ein Qualitätsfilter, der Orderblöcke unter einer gemessenen Trefferquote ausblendet

▸ MSS, inverse FVG, Multi-Timeframe-Struktur, ein 0–100 Konfluenz-Score und E-Mail-/Telegram-Benachrichtigungen

👉 ctrader.com/products/4703


== WAS ALS NÄCHSTES KOMMT ==

Dieser Indikator zeigt Ihnen WO, und jetzt sagt er Ihnen auch, wie oft dieses WO auf Ihrem eigenen Chart gehalten hat. Er nimmt keine Positionsgrößen vor, setzt keine Stops und sitzt nicht aus.


Das ist die andere Hälfte, und genau das automatisieren unsere Portfolio-cBots — derselbe Motor, verifizierte Python/C#-Parität, Ergebnisse live von cTrader verfolgt:

👉 Balanced FTMO Swing, kostenlose Edition, testen Sie es mit Ihren eigenen Kosten: ctrader.com/products/4615


ANWENDUNG

1. Zu cTrader hinzufügen → Chart → Indikatoren → „Liquidity & Structure (SMC)“.

2. Geben Sie ihm ein paar Sekunden: Es lädt die Historie, damit die Messung vollständig ist. „need 20+“ bedeutet, dass Bars fehlen, nicht dass etwas kaputt ist.

3. Wählen Sie aus, welche Elemente gezeichnet werden sollen. Die Standardwerte sind sauber und jeder Parameter erklärt sich im Panel selbst.

4. Es kartiert das Chart live und zeichnet nie neu.


⚠️ SMC ist ein Rahmenwerk, keine Garantie. Dies zeichnet die Karte sauber und sagt Ihnen ehrlich, wie oft sie gehalten hat. Es verspricht keine Gewinnrate.

Zusammenfassung

AI summary
Liquidity & Structure (SMC) Free is a Smart Money Concepts indicator designed for cTrader charts. It automatically identifies and labels key market structure elements including Break of Structure (BOS), Change of Character (CHOCH), and Market Structure Shift (MSS). The indicator also detects and displays Fair Value Gaps (FVG), tracking their filled state in real time. It operates without repainting, ensuring that all visualized signals reflect actual market events as they occur. Users can customize colors, line widths, and select which elements to display. This free version focuses on core structure and gap analysis, providing a clear overlay to assist in market reading. An optional Pro upgrade adds features such as liquidity pools, sweeps, order blocks, a confluence scoring system, and interactive price tooltips. The indicator supports live chart mapping and is suitable for traders applying Smart Money Concepts to various markets.
Indikatorprofil
Indikatorkategorie
Marktstruktur (SMC)
Ausgabetyp
Visualisierung
Filter
Datenanforderungen
Nur Balken
Tick-Daten
Unterstützte Signale
Level – Berührung
Level – Durchbrechen

Kundenbewertungen

5.0
Bewertungen: 1
5
100 %
4
0 %
3
0 %
2
0 %
1
0 %
Kundenbewertungen
July 16, 2026
Liquidity & Structure is a highly reliable, non-repainting indicator that automates core SMC. The free version accurately maps market structure (BOS, CHoCH, MSS) and Fair Value Gaps (FVG), including filled-state tracking. While advanced features like Order Blocks and Liquidity are locked behind a $29 PRO upgrade, the free tier provides an excellent, clean visual overlay. It’s a must-have tool for SMC traders looking to automate charting without the dreaded repainting issue.

Diskussion

Häufig gestellte Fragen (FAQ)

Fair Value Gap
BOS
Liquidity Sweep
CHOCH
Über den cTrader Store verfügbare Produkte, einschließlich Handelsbots, Indikatoren und Plugins, werden von externen Entwicklern bereitgestellt und nur zu Informations- und technischen Zugriffszwecken verfügbar gemacht. cTrader Store ist kein Broker und erbringt keine Anlageberatung, persönlichen Empfehlungen oder eine Garantie für zukünftige Performance.

Mehr von diesem Autor

cBot
ATR
Aggressive
+5
FREE backtest-only. Reproduce Pegasus Gold's +156.13% in your own cTrader. Same engine, same book. No grid.
2.33
Gewinnfaktor
cBot
Balanced
TP Manager
+5
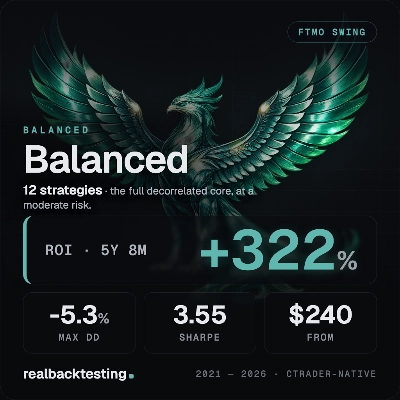
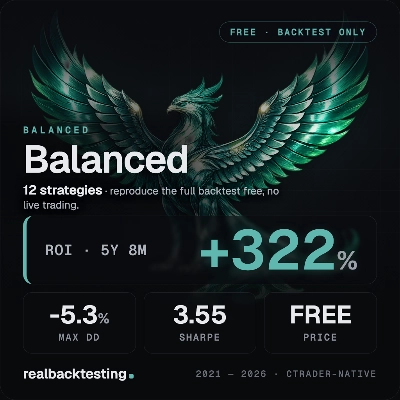
12-strategy portfolio. +322.2% in 5Y8M at -5.26% max DD. No grid. No martingale. Verify every result in your cTrader.
1.67
Gewinnfaktor
Indikator
Key Levels
Market Structure
+1
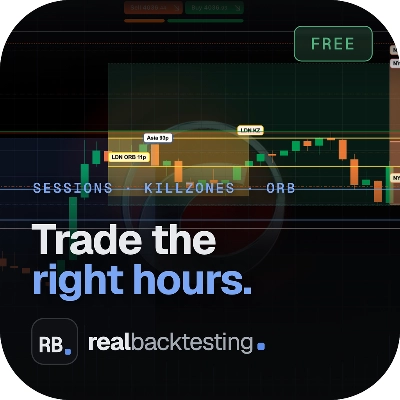
Free: Asia / London / NY sessions, ICT killzones and the opening range. One clean, no-repaint cTrader overlay.
cBot
Prop Firm Fit
Drawdown Guard
+5
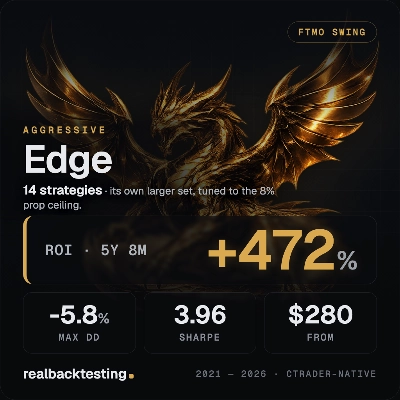
14-strategy portfolio. +472.4% in 5Y8M at -5.78% max DD. No grid. No martingale. Verify every result in your cTrader.
1.64
Gewinnfaktor
cBot
SL Manager
Break Even
+5
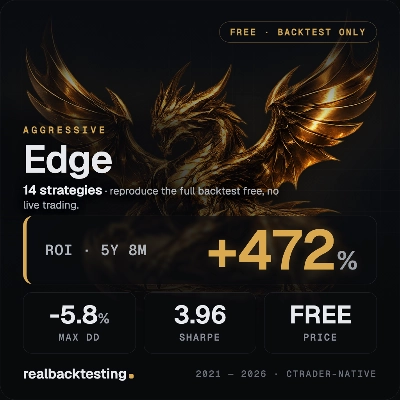
FREE backtest-only. Reproduce Edge's +472.4% in your own cTrader. Same engine, same book. No grid, no martingale.
1.64
Gewinnfaktor
Indikator
BOS
CHOCH
+2
The full SMC suite: BOS / CHoCH / MSS, FVG, liquidity, order blocks and a 0-100 confluence score. No repaint.
cBot
ATR
Balanced
+5
FREE backtest-only. Reproduce Balanced's +322.2% in your own cTrader. Same engine, same book. No grid, no martingale.
1.67
Gewinnfaktor
Indikator
Key Levels
Market Structure
+1
Sessions, ICT killzones, multi-ORB and previous levels. One clean, no-repaint cTrader overlay.
cBot
ATR
Aggressive
+5
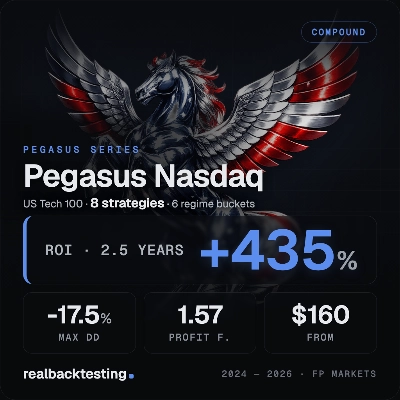
FREE backtest-only. Reproduce Pegasus Nasdaq's +434.98% in your own cTrader. Same engine, same book. No grid.
1.57
Gewinnfaktor
cBot
ATR
Aggressive
+5
8-strategy portfolio. +434.98% in 2Y6M at -17.46% max DD. No grid. No martingale. Verify every result in your cTrader.
1.57
Gewinnfaktor
cBot
Break Even
Conservative
+5
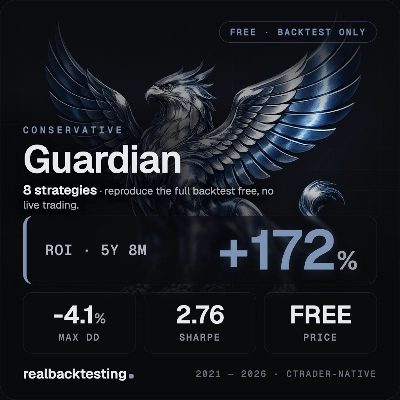
FREE backtest-only. Reproduce Guardian's +171.7% in your own cTrader. Same engine, same book. No grid, no martingale.
1.58
Gewinnfaktor
Desktop-Plugin
Market Scanner
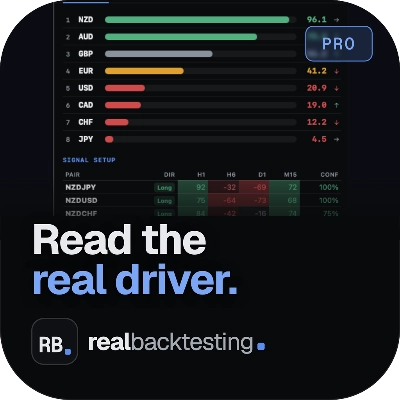
An 8-currency strength ranking, multi-TF heatmap and impulse tracker. Read the real driver at a glance. Read-only.

Das könnte Sie auch noch interessieren

Indikator
RSI
Forex
+10
INDICATOR,LIQUIDITY POOLS,ACCURATE SIGNAL, NO DELAY,80% PROBABILITY
Indikator
ATR
RSI
+4
RSI bands drawn on price, confluence-scored BUY/SELL signals, an ATR stop with three targets
Indikator
RSI
RSI on the main chart with 45/55 momentum levels, overbought/oversold levels, averaged RSI, and multi-timeframe support.
Indikator
SMC
Prop
+8
KILLZONES AND MACRO SESSIONS
Indikator
Forex
cTrader Auto Support & Resistance detects key levels with Fibonacci analysis and sends real-time trading alerts.
Indikator
Prop
Forex
+3
🚀 Simplify Your Trading Decisions With Powerful Technical Analysis.
Indikator
ADX
ATR
+5
EMA-cross signals scored on six confluence layers, with an ATR stop, three targets and a live panel
Indikator
RSI
BTCUSD
+5
Traders Dynamic Index (TDI) — Divergence Edition
Indikator
VWAP
Forex
+13
Custom VWAP Indicator for cTrader
Indikator
Forex
BTCUSD
+4
The Linear Regression Oscillator (LRO) is a technical indicator based on linear regression analysis.
Indikator
SMA
Volume
+3
Stoc​h PRO Quad Rotation Signal (QRS) is an advanced technical analysis indicator developed for cTrader.
Indikator
ATR
RSI
+5
🚀 HAI QUANTUM v4.0 | The Ultimate Quantum Terminal for cTrader (Smart Money & Algorithmic Trading)
Indikator
ATR
RSI
+3
🚀 Specialized algorithm is designed to confirm entry and exit points with precision 🎯
Indikator
EMA
RSI
+4
🚀📈 Plot buy/sell signals on Range Bars using Moving Averages and RSI. Clear, actionable trading insights.🚀📈
Indikator
VWAP
Volume for Renko/Range
Indikator
EMA
Volume
+4
Advanced volume‑profile tool with delta, HVN/LVN zones, and precise POC‑based trade signals.
Indikator
Forex
Crypto
+4
Spot powerful 3-candle reversal patterns like Morning/Evening Star and Soldiers/Crows at key swing highs and lows
Indikator
Volume
Select a price range and read POC, VAH and VAL from tick activity on your cTrader chart.

Preis

30.48M
Gehandeltes Volumen
12.32K
Pip-Gewinn
25
Verkäufe
2.1K
Kostenlose Installationen