
Beschreibung
ÜBERBLICK
Der Waddah Attar Explosion (WAE) Indikator wurde von Ahmad Waddah Attar entwickelt und 2007 der Trading-Community vorgestellt. Er kombiniert die MACD-Momentum-Messung mit der Volatilitätsanalyse der Bollinger-Bänder, um „Preissprung“-Momente zu identifizieren – Zeiträume, in denen der Preis von einer Konsolidierung in eine starke Richtungsbewegung übergeht.
Der Indikator beantwortet zwei Fragen:
- Baut sich Momentum auf? (gemessen an der MACD-Änderungsrate)
- Erweitert sich die Volatilität? (gemessen an der Breite der Bollinger-Bänder)
Wenn beide Bedingungen über einem Rauschfilter (Dead Zone) erfüllt sind, signalisiert dies eine potenzielle explosive Bewegung.
KOMPONENTEN
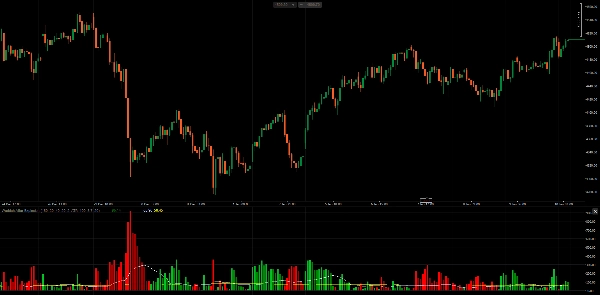
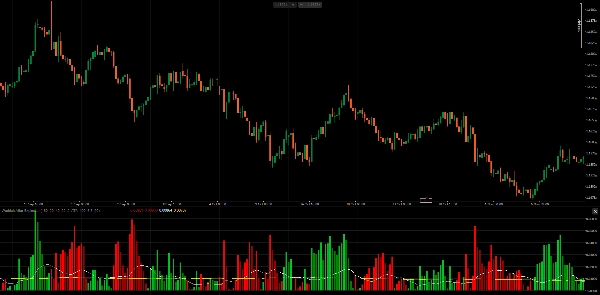
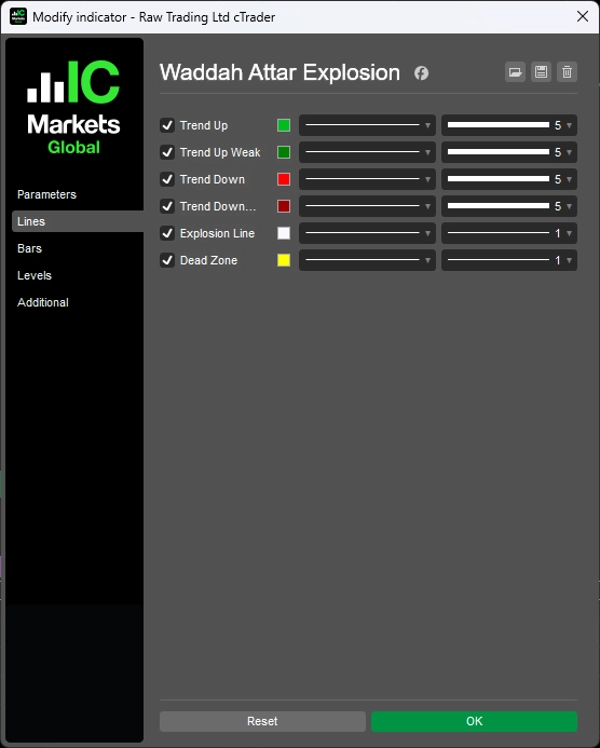
1. Trend-Histogramm (Grün/Rot) Zeigt die Änderungsrate der MACD-Linie, multipliziert mit einem Sensitivitätsfaktor.
- Berechnung:
(MACD_aktuell - MACD_vorherig) × Sensitivität - Grüne Balken: Bullishes Momentum (MACD beschleunigt nach oben)
- Rote Balken: Bärisches Momentum (MACD beschleunigt nach unten)
- Helle Farbe: Momentum steigt im Vergleich zum vorherigen Balken
- Dunkle Farbe: Momentum sinkt im Vergleich zum vorherigen Balken
2. Explosionslinie (Weiß) Stellt die Breite der Bollinger-Bänder dar und zeigt die Ausweitung oder Kontraktion der Volatilität an.
- Berechnung:
BB_Oben - BB_Unten - Steigend: Volatilität nimmt zu (potenzieller Ausbruch)
- Fallend: Volatilität nimmt ab (Konsolidierung)
3. Dead Zone (Gelb) Ein Schwellenwertfilter zur Eliminierung schwacher Signale, die durch Marktrauschen verursacht werden.
- ATR-basiert: Passt sich der aktuellen Marktvolatilität an
- Feste Pips: Statischer Schwellenwert
WIE AHMAD WADDAH ATTAR IHN VERWENDET
Laut dem ursprünglichen Autor:
Einstiegsregeln für Kauf Alle Bedingungen müssen erfüllt sein:
- Grünes Histogramm steigt
- Grünes Histogramm liegt über der Explosionslinie
- Explosionslinie steigt
- Sowohl grünes Histogramm als auch Explosionslinie liegen über der Dead Zone
Einstiegsregeln für Verkauf Alle Bedingungen müssen erfüllt sein:
- Rotes Histogramm steigt
- Rotes Histogramm liegt über der Explosionslinie
- Explosionslinie steigt
- Sowohl rotes Histogramm als auch Explosionslinie liegen über der Dead Zone
Ausstiegsregeln
- Long-Position verlassen, wenn grünes Histogramm unter die Explosionslinie fällt
- Short-Position verlassen, wenn rotes Histogramm unter die Explosionslinie fällt
Wichtige Erkenntnis Der Winkel der Explosionslinie ist entscheidend. Wenn die Explosionslinie nach oben geneigt ist und das Histogramm darüber ausbricht, bestätigt dies, dass die Volatilität aktiv zunimmt – die „Explosion“ ist echt, kein falsches Signal.
PARAMETER
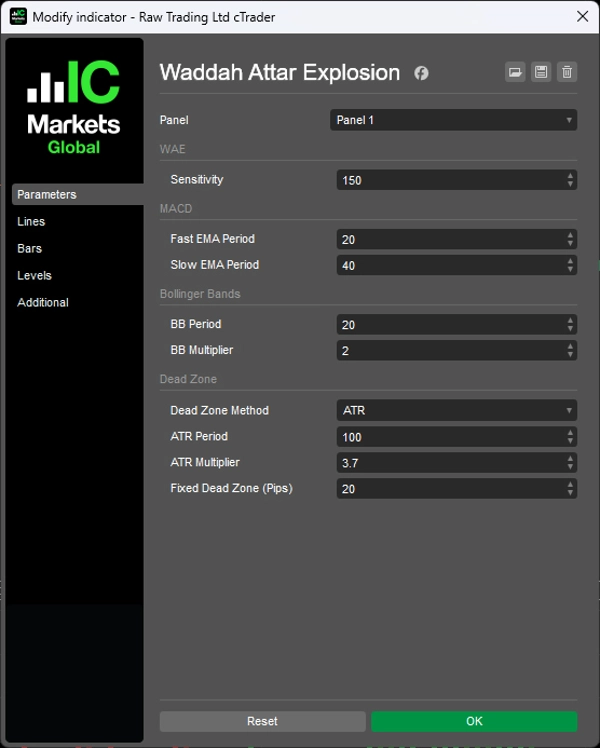
1. Sensitivität
- Sensitivität (150): Multiplikator für die MACD-Änderungsrate
2. MACD
- Schnelle EMA-Periode (20): Schneller gleitender Durchschnitt für die MACD-Berechnung
- Langsame EMA-Periode (40): Langsamer gleitender Durchschnitt für die MACD-Berechnung
3. Bollinger-Bänder
- BB-Periode (20): Rückblickperiode der Bollinger-Bänder
- BB-Multiplikator (2.0): Multiplikator der Standardabweichung
4. Dead Zone
- Dead Zone Methode (ATR): Wahl zwischen ATR-basiert oder festen Pips
- ATR-Periode (100): Periode für die ATR-Berechnung
- ATR-Multiplikator (3.7): Multiplikator, der auf die ATR für die Dead Zone angewendet wird
- Feste Dead Zone (20): Wert der Dead Zone in Pips (bei Verwendung der festen Methode)
HINWEISE
- Der Indikator funktioniert auf allen Zeitrahmen. Der ursprüngliche Autor empfahl H1 und M30.
- Die ATR-basierte Dead Zone wird empfohlen, da sie sich an verschiedene Instrumente und Marktbedingungen anpasst.
- Der Sensitivitätsparameter muss möglicherweise je nach Zeitrahmen und Instrumentenvolatilität angepasst werden.
- Dieser Indikator identifiziert die Ausrichtung von Momentum und Volatilität – er sagt die Richtung nicht eigenständig voraus. Es wird empfohlen, ihn zusammen mit Trendanalysen oder Unterstützungs-/Widerstandsniveaus zu verwenden.
__________________________________________________________________________________________
MEHR KOSTENLOSE INDIKATOREN
Entdecken Sie eine breite Palette von Marktanalysetools – von Struktur und Volumen bis hin zu Regression, Volatilität und benutzerdefinierten Zeitrahmen.
Der Quellcode ist auf GitHub Repository verfügbar.
Alle kostenlos nutzbar. Wenn Sie jedoch eine Kaffee-Unterstützung senden möchten, können Sie dies hier tun.
Support/Widerstand
Volumen
- Volumen-Aktivitätsprofiler
- Volumen-Effizienz-Analysator
- Volumenprofil-Analyse
- Volumenprofil - Aktualisiert
- Volumenstreuungsanalyse
- VWAP (Volumen-gewichteter Durchschnittspreis)
Gleitende Durchschnitte
- SSL-Kanal
- Verankerter gleitender Durchschnitt
- Abweichungsskaliertes gleitendes Mittel
- Gann High Low Aktivator
- Sofortige Trendlinie
- Kaufman Adaptive MA mit Trend Vision
- Gleitender Durchschnittskanal
- Suite gleitender Durchschnitte
- Trendkanal gleitender Durchschnitt
Dienstprogramme/Benutzerdefiniert
Regressionsbasiert
Volatilität
Oszillatoren
__________________________________________________________________________________________
HAFTUNGSAUSSCHLUSS
Trading beinhaltet Risiken. Dieser Indikator ist nur für die technische Analyse gedacht – wenden Sie stets ein angemessenes Risikomanagement an und handeln Sie verantwortungsbewusst.
FEEDBACK & VERBESSERUNGEN
Wenn Sie Vorschläge, Funktionswünsche oder Ideen zur Verbesserung haben, hinterlassen Sie bitte einen Kommentar im Diskussions-Tab. Ihr Feedback hilft, den Indikator für alle zu verbessern.


![„[Stellar Strategies] QQE“-Logo](https://cdn.ctrader.com/image/webp/e702104a-874c-4b39-97dd-fb34518d1015_27712)


