
Descripción
DETECTOR DE GIROS
Puntos estructurales de giro + Retroceso de Fibonacci + RSI
--------------------------------------------------
INDICADOR GRATUITO
Identifica giros estructurales. Ve la tendencia. Opera con confluencia.
--------------------------------------------------
LO QUE HACE ESTE INDICADOR
Swing Detector identifica los máximos y mínimos estructurales de giro usando detección de extremos locales con profundidad configurable y filtrado automático por desviación.
Luego conecta los giros con líneas de tendencia, superpone niveles estándar de retroceso de Fibonacci y muestra el valor actual del RSI cerca del precio.
--------------------------------------------------
CARACTERÍSTICAS PRINCIPALES
- Detección de puntos de giro (profundidad configurable)
- DESVIACIÓN AUTOMÁTICA: Filtrado basado en ATR que se adapta a cualquier marco temporal
- Modo de desviación fija en pips (para control manual)
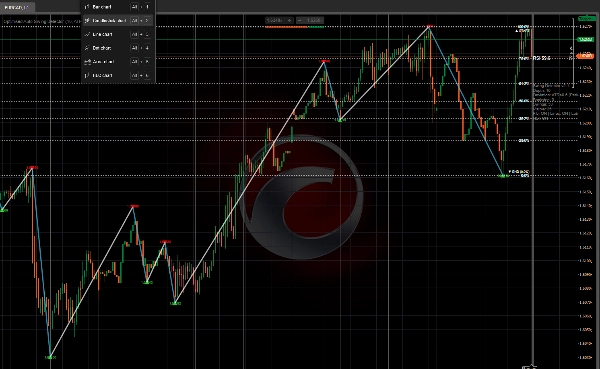
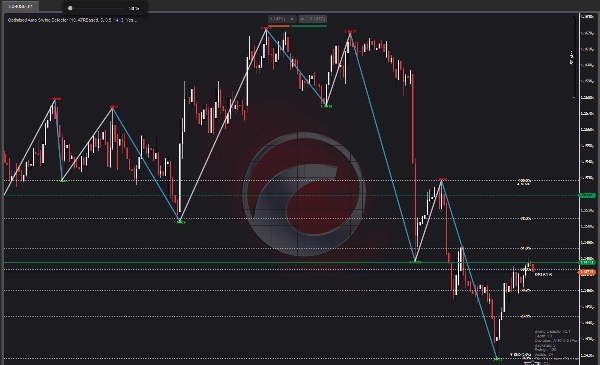
- Líneas de tendencia de giro (subida azul, bajada naranja)
- RETROCESO DE FIBONACCI (0, 23.6, 38.2, 50, 61.8, 78.6, 100 por ciento)
- SUPERPOSICIÓN DEL VALOR RSI (RSI actual cerca del precio)
- Colores personalizables
- Optimizado para rendimiento (máximo de barras para dibujar)
--------------------------------------------------
DESVIACIÓN AUTOMÁTICA - CARACTERÍSTICA CLAVE
Dos modos de desviación disponibles:
- PIPS FIJOS: Establece una distancia mínima fija en pips entre giros
- BASADO EN ATR (AUTO): Desviación dinámica basada en la volatilidad actual
POR QUÉ IMPORTA LA DESVIACIÓN AUTOMÁTICA:
- M1 a M5: Desviación ajustada (captura giros pequeños)
- H1 a H4: Desviación media (captura estructura)
- D1 a MN1: Desviación amplia (captura giros mayores)
El indicador se adapta automáticamente al marco temporal que estés usando. No se necesita ajuste manual al cambiar de gráficos.
Esto hace que Swing Detector sea usable en TODOS los marcos temporales — desde gráficos de 1 minuto hasta mensuales.
--------------------------------------------------
RETROCESO DE FIBONACCI - CARACTERÍSTICA CLAVE
Para el último giro completado, el indicador dibuja:
- 0.0 por ciento (inicio del giro)
- 23.6 por ciento
- 38.2 por ciento
- 50.0 por ciento
- 61.8 por ciento
- 78.6 por ciento
- 100.0 por ciento (fin del giro)
Activa o desactiva líneas y etiquetas. Todos los niveles están codificados por colores para una referencia visual rápida.
--------------------------------------------------
SUPERPOSICIÓN RSI - CARACTERÍSTICA CLAVE
El valor actual del RSI se muestra cerca del precio con codificación de colores:
- ROJO: RSI por encima de 70 (sobrecompra)
- VERDE: RSI por debajo de 30 (sobreventa)
- BLANCO: RSI entre 30 y 70 (neutral)
Esto proporciona un contexto inmediato del momentum sin abrir una ventana RSI separada.
--------------------------------------------------
ELEMENTOS VISUALES
- Flechas rojas hacia abajo = Máximos de giro
- Flechas verdes hacia arriba = Mínimos de giro
- Líneas azules = Subida (de mínimo a máximo)
- Líneas naranjas = Bajada (de máximo a mínimo)
- Líneas horizontales doradas = Niveles de Fibonacci
- Etiquetas blancas = Porcentajes de Fibonacci
- Valor RSI = RSI actual cerca del precio
- Panel de información = Profundidad, desviación, retroceso, conteo de giros
--------------------------------------------------
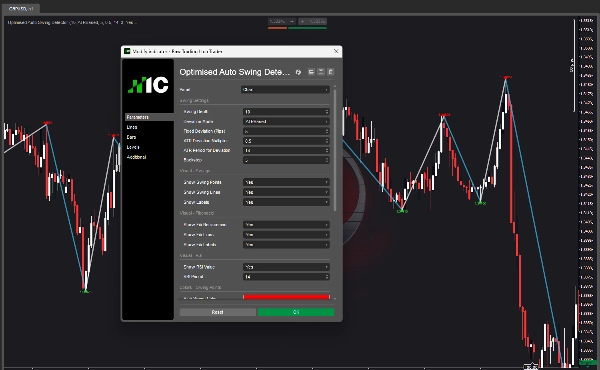
RESUMEN DE PARÁMETROS
CONFIGURACIÓN DE GIROS:
- Profundidad de giro: Cuántas barras revisar para extremos locales
- Modo de desviación: Pips fijos o basado en ATR (Auto)
- Desviación fija: Distancia mínima en pips entre giros
- Multiplicador de desviación ATR: Multiplicador para desviación basada en ATR
- Periodo ATR: Periodo para cálculo del ATR
- Retroceso: Barras mínimas entre giros
VISUAL - GIROS:
- Mostrar puntos de giro: Alternar flechas
- Mostrar líneas de giro: Alternar líneas de tendencia
- Mostrar etiquetas: Alternar etiquetas de precio
VISUAL - FIBONACCI:
- Mostrar retroceso Fib: Alternar superposición de Fibonacci
- Mostrar líneas Fib: Alternar líneas horizontales
- Mostrar etiquetas Fib: Alternar etiquetas de porcentaje
VISUAL - RSI:
- Mostrar valor RSI: Alternar superposición RSI
- Periodo RSI: Periodo para cálculo del RSI
COLORES:
- Color de giro alto
- Color de giro bajo
- Color de línea de subida
- Color de línea de bajada
- Color de línea Fib
- Color de texto Fib
- Color de etiqueta RSI
RENDIMIENTO:
- Máximo de barras para dibujar: Limita el dibujo para un rendimiento más rápido
--------------------------------------------------
CASOS DE USO
- Identificar puntos estructurales de giro en CUALQUIER marco temporal
- Dibujar líneas de tendencia entre giros
- Usar niveles de Fibonacci para entradas, salidas y objetivos de ganancia
- Confirmar operaciones con confluencia de RSI
- Entender la estructura del mercado de un vistazo
- Cambiar marcos temporales sin ajustar parámetros (Desviación Automática)
--------------------------------------------------
USABILIDAD EN MARCOS TEMPORALES
Con la DESVIACIÓN AUTOMÁTICA activada, el indicador funciona en:
- M1, M5, M15 (scalping)
- M30, H1, H4 (trading diario)
- D1 (trading de giro)
- W1, MN1 (trading de posición)
Un indicador. Todos los marcos temporales.
--------------------------------------------------
ACTUALIZA A ZONAS DE CALOR ESTRUCTURALES
Este indicador gratuito te muestra giros y estructura.
Zonas de Calor Estructurales va más allá — mapea la intensidad de participación, aceptación vs rechazo y compromiso del mercado a través de múltiples zonas.
Busca Zonas de Calor Estructurales en la Tienda cTrader.
--------------------------------------------------
ACTUALIZA A INVICTUS EA
Invictus EA usa la misma tecnología estructural para ejecutar operaciones automatizadas.
Busca Invictus en la Tienda cTrader.
--------------------------------------------------
NOTAS TÉCNICAS
- Indicador superpuesto
- Funciona en cualquier marco temporal y símbolo
- No repinta (los giros son históricos)
- Optimizado para rendimiento
--------------------------------------------------
SOPORTE
Actualizaciones de por vida incluidas.
PARA MÁS INFORMACIÓN - Haz clic en el perfil del desarrollador abajo.
Resumen
Valoraciones de clientes
5 | 100 % | |
4 | 0 % | |
3 | 0 % | |
2 | 0 % | |
1 | 0 % |


![Logotipo de "Gaussian Channel [Iridio Capital]"](https://cdn.ctrader.com/image/webp/7c039209-5573-4a54-a072-f9528b503103_41960)


