present
سجل واحصل على خصم 50 دولارًا على مشترياتك الأولى
Trading product for Advanced battelzone density heat map مؤشر Key Levels Pin Bar, image 1
Advanced battelzone density heat map
مؤشر
الإصدار 1.0، Jun 2026
Windows, Mac
5.0
التقييمات: 1
Trading product for Advanced battelzone density heat map مؤشر Key Levels Pin Bar, image 2
Trading product for Advanced battelzone density heat map مؤشر Key Levels Pin Bar, image 3
Trading product for Advanced battelzone density heat map مؤشر Key Levels Pin Bar, image 4
منذ 14/01/2025
5
المبيعات
401
التثبيتات المجانية

الوصف

مناطق الحرارة الهيكلية

خريطة شدة المشاركة


--------------------------------------------------


شاهد أين تحدث معارك السعر. شاهد أين يتجاهل.


معظم أدوات الدعم/المقاومة ترسم خطوطًا حيث كان السعر.


مناطق الحرارة الهيكلية تجيب: هل يهتم السوق فعلاً بهذا المستوى؟


--------------------------------------------------


تقييم شدة الحرارة (0 إلى 100)


يقوم المؤشر بتحليل تجمع التقلبات ويمنح درجة حرارة:


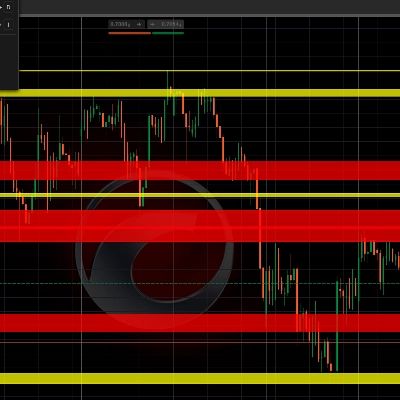
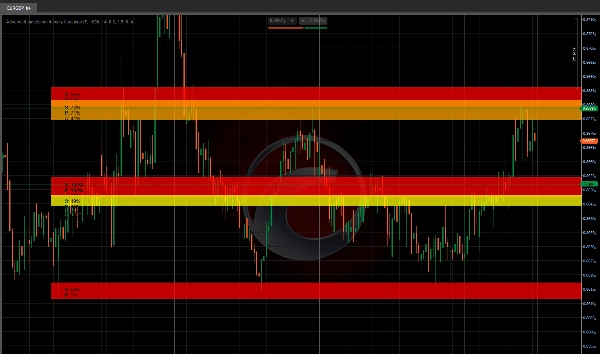
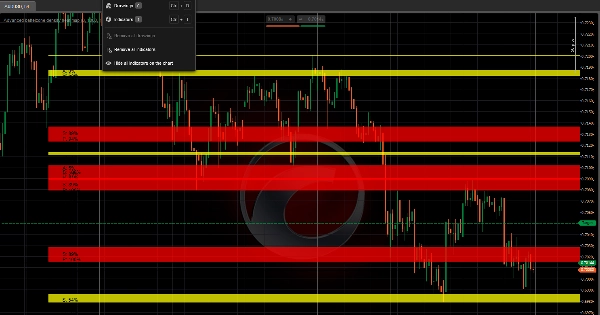
- المناطق الحمراء (80 إلى 100 حرارة) = أقوى مشاركة هيكلية

- المناطق البرتقالية (60 إلى 80 حرارة) = منطقة هيكلية نشطة

- المناطق الصفراء (40 إلى 60 حرارة) = اهتمام معتدل

- المناطق الزرقاء (أقل من 40 حرارة) = هيكل ضعيف


حرارة أعلى = تجمع تقلبات أكثر = اهتمام أكبر من السوق.


--------------------------------------------------


تتبع القبول مقابل الرفض


لكل منطقة حرارة هيكلية، يتتبع المؤشر سلوك السعر:


- القبول = يغلق السعر داخل المنطقة (سلوك الدعم)

- الرفض = يترك السعر ذيول طويلة عند المنطقة (سلوك المقاومة)


هذا يخبرك ما إذا كانت المنطقة من المحتمل أن تثبت أو تنعكس.


--------------------------------------------------


تحليل تفاعل السوق


يقيس النظام:


- لمسات الشمعة (كم مرة يزور السعر كل منطقة)

- الإغلاقات داخل المنطقة (معدل القبول)

- رفض الذيول (معدل الرفض)

- فترة النظر للخلف القابلة للتعديل


تفاعل منخفض = منطقة ضعيفة. تفاعل عالي = منطقة حرارة هيكلية.


--------------------------------------------------


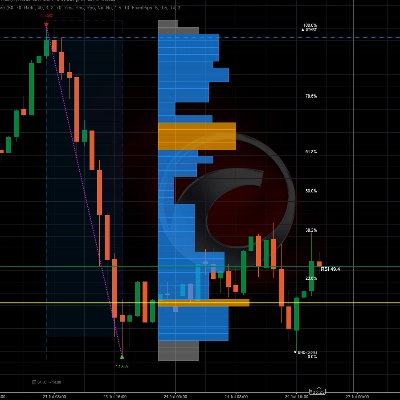
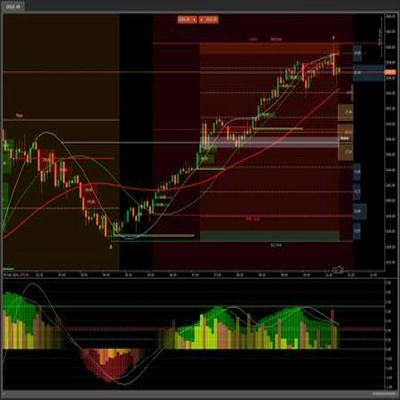
رسم شدة بصري


- مناطق ملونة حسب درجة الحرارة (الأحمر = الأشد حرارة)

- امتدادات الهالة لتصور الرفض

- تسميات بيانات تظهر: الحرارة / المشاركة / القبول / الرفض

- تنظيف تلقائي (إعادة رسم المناطق تلقائيًا)

- أسهم اختيارية لأعلى/أسفل التقلبات


--------------------------------------------------


المعلمات الرئيسية


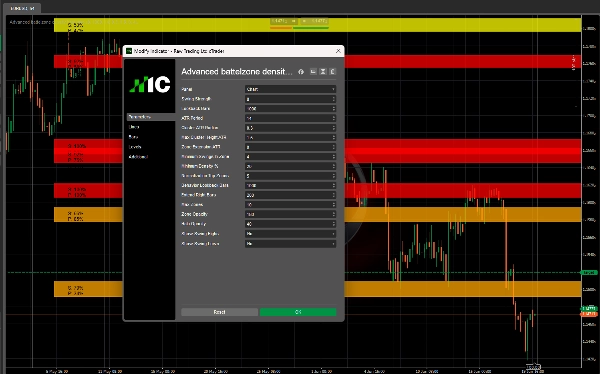
- قوة التقلب: حساسية المحور (أعلى = تقلبات أقل)

- أشرطة النظر للخلف: مدى الرجوع لاكتشاف التقلبات

- فترة ATR: لحساب نصف القطر التكيفي

- نصف قطر تجمع ATR: مدى قرب التقلبات لتتجمع

- أقصى ارتفاع للتجمع ATR: يرفض المناطق الأوسع من هذا

- تمديد المنطقة ATR: حجم الهالة لاكتشاف الرفض

- الحد الأدنى للتقلبات في المنطقة: الحد الأدنى لحجم التجمع

- الحد الأدنى لدرجة الحرارة: عرض المناطق التي تتجاوز هذا فقط

- أشرطة النظر لسلوك: فترة تتبع التفاعل

- الحد الأقصى للمناطق: أقصى عدد من المناطق المعروضة

- شفافية المنطقة / الهالة: الشفافية البصرية


--------------------------------------------------


حالات الاستخدام


- العثور على مناطق حرارة هيكلية حقيقية (حرارة عالية + تفاعل عالي)

- التمييز بين مناطق القبول ومناطق الرفض

- تجنب المناطق ذات الحرارة المنخفضة والمشاركة المنخفضة

- تحديد تجمعات هيكلية لوضع الدخول والخروج

- التوافق مع مؤشرات الاتجاه أو تدفق الأوامر


--------------------------------------------------


ملاحظات تقنية


- مؤشر تراكبي (يرسم على مخطط السعر)

- يعمل على أي إطار زمني ورمز

- يتكيف تلقائيًا مع التقلب عبر ATR

- لا يعيد الرسم (التقلبات تاريخية)


--------------------------------------------------


من صانعي INVICTUS EA


مناطق الحرارة الهيكلية تشترك في نفس تقنية المشاركة الهيكلية الموجودة في نظام التداول الآلي Invictus.


--------------------------------------------------


إفصاح المخاطر


هذا المؤشر هو أداة تحليلية. لا يولد إشارات تداول آلية. جميع قرارات التداول تبقى مسؤولية المستخدم.


--------------------------------------------------


الدعم


تحديثات مدى الحياة متضمنة.


لمزيد من المعلومات - انقر على ملف المطور أدناه.

الملخص

ملخص الذكاء الاصطناعي
The Advanced Battlezone Density Heat Map is a price chart overlay indicator designed to identify and visualize key structural zones in the market based on price participation intensity. It analyzes swing clustering to assign a heat score (0-100) to price levels, highlighting zones where the market shows strong engagement (red zones), moderate interest (yellow), or weak structure (blue). The indicator tracks price behavior within these zones, distinguishing between acceptance (price closes inside the zone, indicating support) and rejection (price forms long wicks, indicating resistance), helping users assess whether a zone is likely to hold or reverse.

Key features include color-coded heat zones, halo extensions for rejection visualization, and data labels displaying heat, participation, acceptance, and rejection scores. The system measures candle touches, closes inside zones, and wick rejections over a configurable lookback period to quantify market engagement. Adjustable parameters allow customization of swing sensitivity, cluster radius, zone size, and visual opacity.

This tool supports any timeframe and symbol, adapts to volatility using ATR, and does not repaint historical swings. It is intended for identifying genuine structural heat zones, differentiating acceptance from rejection areas, and aiding entry and exit placement in conjunction with other trend or order flow indicators. The indicator is analytical and does not generate automated trading signals.
ملف تعريف المؤشر
فئة المؤشر
الدعم والمقاومة
نوع المخرجات
التصور
متطلبات البيانات
أعمدة السعر فقط
الإشارات المدعومة
الانقطاع
الانعكاس
قوة الاتجاه
لمس المستوى
كسر المستوى

مناقشة

تقييمات العملاء

5.0
التقييمات: 1
5
100 %
4
0 %
3
0 %
2
0 %
1
0 %
تقييمات العملاء
June 29, 2026
Advanced Battlezone Density Heat Map offers an original approach to structural market analysis by visualizing areas of concentrated market participation instead of traditional support and resistance levels. The indicator is stable, highly configurable and particularly useful for Smart Money, discretionary and price action trading workflows.

الأسئلة الشائعة

Key Levels
Pin Bar
BOS
Market Structure
Supply & Demand
ATR
Support & Resistance
يتم توفير المنتجات المتاحة من خلال cTrader Store، بما في ذلك روبوتات التداول والمؤشرات والإضافات، من قبل مطوري الطرف الثالث وإتاحتها لأغراض الوصول المعلوماتي والفني فقط. cTrader Store ليس وسيطًا ولا يقدم نصائح استثمارية أو توصيات شخصية أو أي ضمان للأداء المستقبلي.

المزيد من هذا المؤلف

مؤشر
ATR
RSI
+5
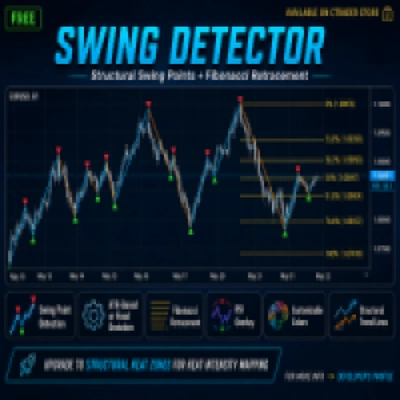
Free swing detector with Fibonacci retracement and RSI overlay. Auto-deviation adapts to any timeframe
مؤشر
Volume
Imbalance
+1
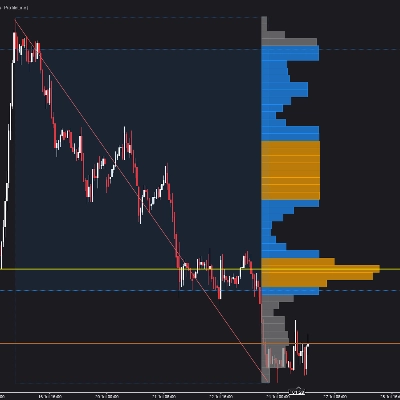
Volume profile indicator that auto-detects the latest trendline. Shows POC, Value Area (VAH/VAL), and High Volume Nodes
مؤشر
ATR
RSI
+4
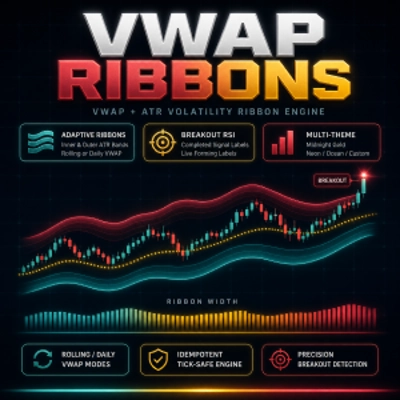
VWAP with ATR ribbon bands and RSI labels on completed breakouts — live forming labels on cTrader.
مؤشر
EMA
Channel
+3
Real-time squeeze detection, dual-horizon trend scoring & institutional breakout validation HUD dashboard.
مؤشر
ATR
BOS
+5
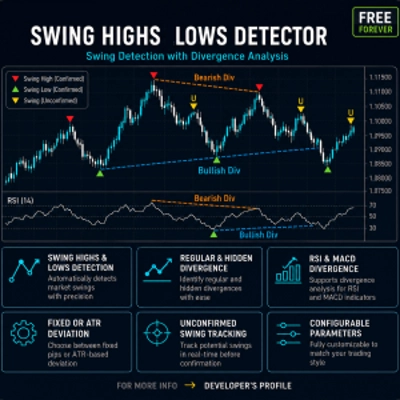
Auto Swing detection with regular and hidden divergence analysis. RSI and MACD divergence detection.
مؤشر
ATR
RSI
+5
Multi-factor VWAP mean-reversion signals with ATR bands, volume exhaustion, and RSI gate on cTrader.
مؤشر
MSS
Volume
+3
Rejection-based volume profile with tiered heat zones, POC levels and a fully draggable anchor on cTrader.
cBot
ATR
Wedge
+5
15 YEARS RESULTS :Win rate:93% | ROI+19000% | Trades:87,000 | Profit Factor 1.2 | Currency Pairs:22 | $10k to 500k$ |
1.2
عامل الربح
مؤشر
MSS
VWAP
+5
VWAP mean-reversion signals combined with a ribbon-anchored volume profile, VAH/VAL, POC and HVN levels.
مؤشر
RSI
Volume
+3
Auto-detects swings, Includes POC, Value Area (VAH/VAL), High Volume Nodes (HVN), Fibonacci retracement, and RSI overlay
مؤشر
BOS
Flag
+5
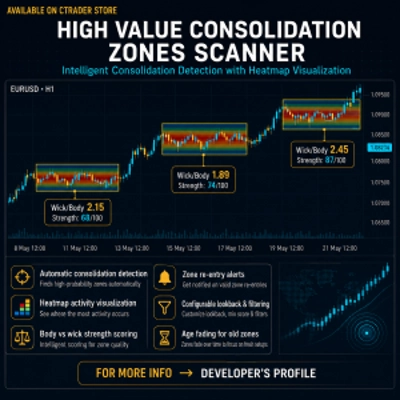
Detect consolidation zones. Heatmap shows activity density. Body vs wick scoring reveals true strength zones.
مؤشر
ATR
EMA
+5
Multi-factor volatility squeeze detector, dual-trend scoring & breakout validation dashboard. No repaint.

قد يعجبك أيضًا

مؤشر
AI
ATR
+20
Buy and Sell Signals
مؤشر
MACD
Forex
+1
😎Read the description before purchasing💩
مؤشر
AI
Prop
+7
EMA Clouds, Multi-Timeframe (MTF) Overlay, Swing High/Low detection, and a smart Dashboard with neutral zone filtering.
مؤشر
Volume
Order Block
+1
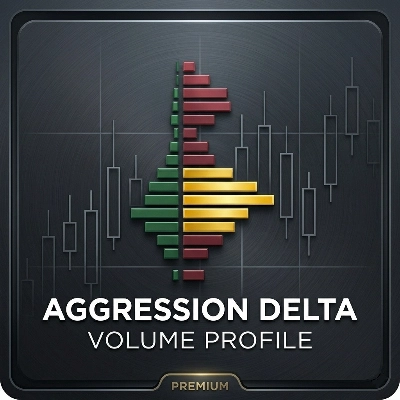
Elevate your market analysis with the Aggression Delta Volume Profile, a premium, institutional-grade order flow utility
مؤشر
ATR
Forex
+2
Trade fearlessly: auto-adjusts order blocks, manages risks, and ensures precision. Was Free for early users now -80%
مؤشر
ADX
ATR
+5
Configure, simulate, and analyze trading strategies with custom filters, multi-target exits, and detailed performance me
مؤشر
AI
BOS
+4
Golden Boom and Crash Spike Detector is a trading tool designed for Crash 300 and Boom 300 indices on M1 Timeframe.
مؤشر
Customize your Moving Average! Choose any timeframe and price source for precision and flexibility in your analysis.
شعار "CVD"
مشهور
4.6
(3)
$20
/
$30
مؤشر
Signal
Cumulative Volume Delta tracks the net difference in tick volume between buying and selling pressure over time
مؤشر
ATR
Wedge
+2
Strong Supertrend Turn Market Movement into a Clear Map Market analysis
شعار "Market Regime_Detector"
الأعلى تقييمًا
4.6
(5)
$23
مؤشر
ADX
ATR
+5
Identifies TRENDING, RANGING and VOLATILE markets with pullback detection. Anti-noise filter. Works on ANY chart.
مؤشر
VWAP
Support & Resistance
Trading.FC$_vwap Algo shows VWAP trends, dynamic support/resistance and deviation bands to spot potential trade entries.
شعار "DrbcLevels"
الأعلى تقييمًا
4.0
(4)
$19
/
$29
مؤشر
Key Levels
Break & Retest
+5
Premium Discount Levels - Professional Dealing Range Zones with Draggable Lines, Alerts, Wartermark & Backtest Mode.
مؤشر
AI
ATR
+19
QX SessionBox ORB: Session boxes + ORB levels + clean dashboard with optional closed-candle breakout signals.
شعار "ICT Killzones & Macros"
الأعلى تقييمًا
4.7
(4)
$20
/
$30
مؤشر
SMC
Prop
+8
KILLZONES AND MACRO SESSIONS
مؤشر
AI
ATR
+23
Candle Timer best used for Scalper
مؤشر
Doji
Volume
+5
Instantly spot high-liquidity institutional moves with clean, non-obtrusive triangle alerts on cTrader charts.
مؤشر
ATR
BOS
+5
Opening ranges, dynamic trend channels, and multi-scale breakout/retest analysis for clear intraday chart decisions.

السعر

منذ 14/01/2025
5
المبيعات
401
التثبيتات المجانية