Inside CandlePRO
Gösterge
159 i̇ndirmeler
Sürüm 1.0, Dec 2025
Windows, Mac
5.0
Değerlendirmeler: 1
Açıklama
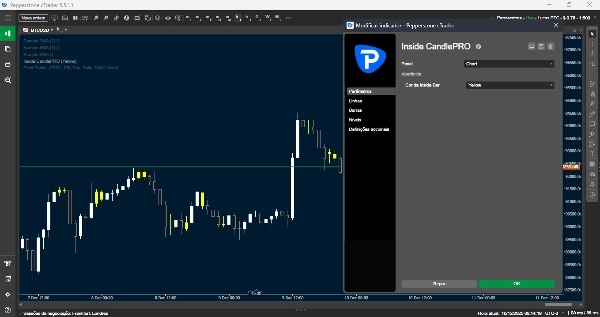
Inside Candle PRO - Profesyonel Inside Bar Desen Algılayıcı
Inside Candle PRO ile Inside Bar desenlerini otomatik olarak algılayın, grafiklerinizde konsolidasyon desenlerini tanımlayan ve vurgulayan teknik bir gösterge.
Inside Bar nedir?
Inside Bar, bir mumun tamamen önceki mumun aralığı içinde olması durumunda oluşur (daha düşük yüksek ve daha yüksek düşük). Bu desen piyasa konsolidasyonunu gösterir ve önemli fiyat hareketlerinden önce gelebilir.
Ana Özellikler:
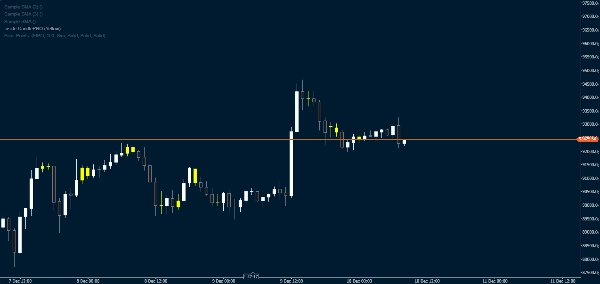
- Inside Barların otomatik gerçek zamanlı algılanması
- Özelleştirilebilir renklerle görsel vurgulama
- Sorunsuz çalışma için optimize edilmiş performans
- Tüm zaman dilimlerinde ve enstrümanlarda çalışır
- Basit ve sezgisel arayüz
Neden Inside Candle PRO Kullanmalısınız?
- Konsolidasyon bölgelerini hızlıca tanımlayın
- Olası kırılmalara hazırlanın
- Görsel teknik analizlerinizi geliştirin
- Desenleri tanımlamada zaman kazanın
Özelleştirme:
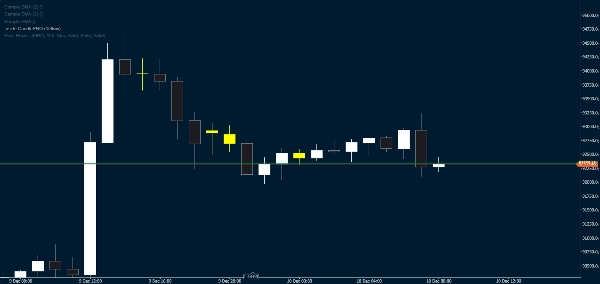
Inside Barları vurgulamak için 8 farklı renkten seçim yaparak göstergenizi grafik stilinize uyarlayın.
Uyumluluk:
Tüm enstrümanlarda (Forex, Endeksler, Hisseler, Kripto Paralar) ve herhangi bir zaman diliminde çalışır.
Özet
YZ özeti
Inside Candle PRO is a technical indicator designed to automatically detect Inside Bar patterns on trading charts. An Inside Bar occurs when a candle’s range is fully contained within the previous candle’s range, signaling market consolidation that may precede significant price movements. This indicator highlights these patterns in real time with customizable colors, supporting up to eight color options to fit various chart styles.
The tool operates smoothly across all timeframes and instruments, including Forex, indices, stocks, cryptocurrencies, and commodities. Its interface is simple and intuitive, enabling traders to quickly identify consolidation zones and prepare for potential breakouts. Inside Candle PRO enhances visual technical analysis by saving time in pattern recognition and improving chart readability.
Key features include automatic real-time detection, visual highlighting, optimized performance, broad market compatibility, and customization options. It supports major symbols such as BTCUSD, EURUSD, GBPUSD, NZDUSD, USDJPY, XAUUSD, and NAS100, among others. This indicator is suitable for traders seeking to incorporate Inside Bar pattern analysis into their trading strategies across diverse markets and timeframes.
Gösterge profili
Müşteri değerlendirmeleri
5.0
Değerlendirmeler: 1
5 | 100 % | |
4 | 0 % | |
3 | 0 % | |
2 | 0 % | |
1 | 0 % |
Müşteri değerlendirmeleri
December 10, 2025
Inside CandlePRO highlights clean Inside Bar structures and their breakout zones. Great for intraday momentum and consolidation setups. Lightweight, accurate and easy to read. Can get busy on lower TFs, but filtering helps. Alerts and volatility filters would make it even better.
Tartışma
SSS
BTCUSD
Forex
Indices
EURUSD
Commodities
GBPUSD
NZDUSD
Prop
Crypto
Stocks
XAUUSD
NAS100
USDJPY
cTrader Store üzerinden erişilebilen işlem botları, göstergeler ve eklentiler gibi ürünler, üçüncü taraf sağlayıcılar tarafından sağlanır ve yalnızca bilgilendirme ve teknik erişim amaçlarıyla sunulur. cTrader Store bir broker değildir ve yatırım tavsiyesi, kişisel öneriler vermez veya gelecekteki performansı garanti etmez.


Fiyat
Başlangıç 26/10/2025
6
Satışlar
517
Ücretsiz yüklemeler