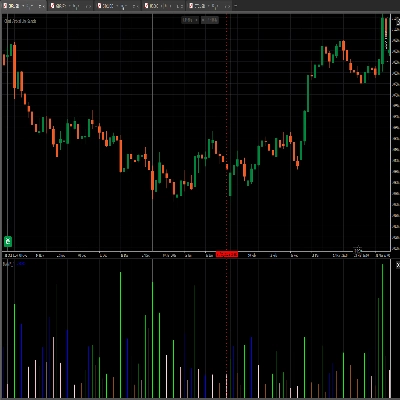
ตัวบ่งชี้ cTrader นี้ระบุและแสดงภาพ ความไม่สมดุลของตลาดเฉพาะครั้งแรก ที่เกิดขึ้นในช่วงสามช่วงเวลาการซื้อขายหลักของนิวยอร์ก ออกแบบมาสำหรับผู้ปฏิบัติงาน ICT (Inner Circle Trader) ที่เน้นการตั้งค่า "ครั้งแรกที่นำเสนอ" เป็นรอยเท้าของสถาบันที่มีความน่าจะเป็นสูง
ฟังก์ชันหลัก (Core)
ตัวบ่งชี้จะตรวจสอบตลาดตั้งแต่เปิดแต่ละช่วงเวลาและ "ล็อก" ความไม่สมดุลครั้งแรกที่พบ เมื่อมีการวาดความไม่สมดุลประเภทหนึ่ง (เช่น FVG) สำหรับช่วงเวลาหนึ่ง จะไม่วาดอีกครั้งจนกว่าช่วงเวลาถัดไปจะเริ่มต้น
1. ประเภทความไม่สมดุลที่ตรวจพบ
- ช่องว่างมูลค่ายุติธรรม (FVG): โครงสร้างสามแท่งเทียนที่ไส้เทียนแท่งแรกและแท่งที่สามไม่ทับซ้อนกัน ทิ้ง "ช่องว่าง" ในช่วงราคาของแท่งเทียนที่สอง
- ความไม่สมดุลของปริมาณ (VI): เกิดขึ้นเมื่อมีช่องว่างระหว่าง ตัวแท่ง (เปิด/ปิด) ของแท่งเทียนสองแท่งติดต่อกัน แม้ว่าจะมีการทับซ้อนของไส้เทียน
- ช่องว่างสภาพคล่อง (LV): ช่องว่างที่รุนแรงมากขึ้นซึ่งไม่มีการเคลื่อนไหวของราคาเลยระหว่างไส้เทียนของแท่งเทียนสองแท่งติดต่อกัน (เป็นการ "กระโดด" ของราคาโดยสมบูรณ์)
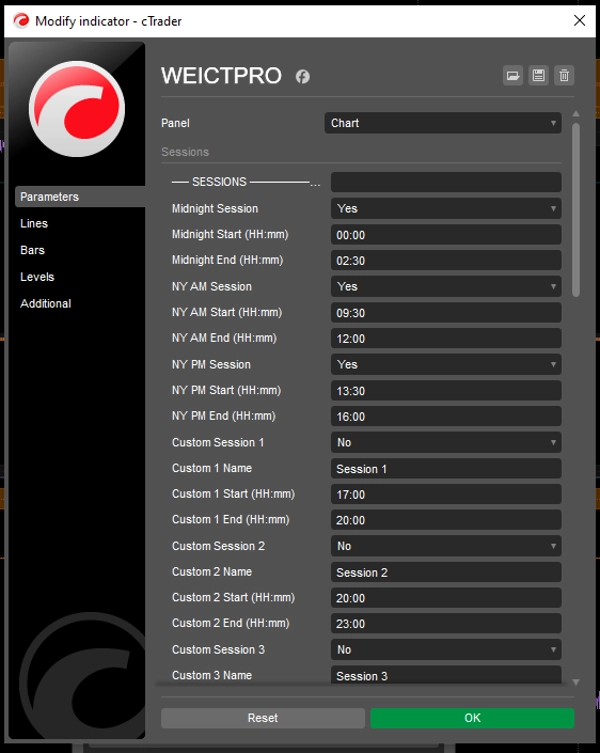
2. ช่วงเวลาที่ตรวจสอบ (เวลานิวยอร์ก)
ตัวบ่งชี้จะแปลงเวลาบนชาร์ตของคุณเป็น เวลาตะวันออก (ET) เพื่อการติดตาม:
- เที่ยงคืน: 00:00 – 02:30
- เช้านิวยอร์ก: 09:30 – 12:00
- บ่ายนิวยอร์ก: 13:30 – 16:00
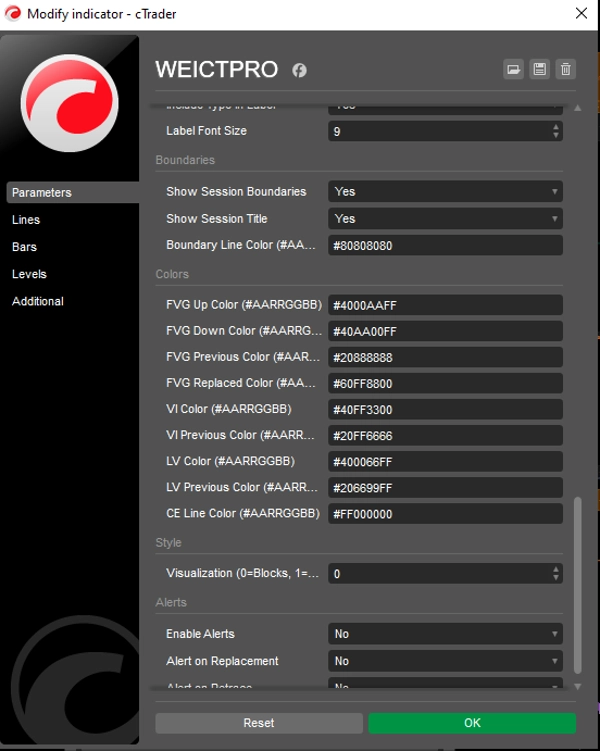
คุณสมบัติด้านภาพ
- การขยายแบบไดนามิก: กล่องถูกวาดจากจุดเริ่มต้นและขยายไปข้างหน้าโดยอัตโนมัติตามจำนวนแท่งที่ผู้ใช้กำหนด (
Extend Bars) เพื่อแสดงการสนับสนุน/ต้านทานในอนาคตที่เป็นไปได้ - การบุกรุกตามมา (CE): วาดเส้นกลางแบบประที่ผ่านความไม่สมดุล ในทฤษฎี ICT ระดับ 50% (CE) เป็นจุดอ้างอิงสำคัญของสถาบัน
- การติดป้ายอัตโนมัติ: ทำเครื่องหมายแต่ละกล่องอย่างชัดเจนด้วยชื่อช่วงเวลาและประเภทความไม่สมดุล (เช่น "NY AM +FVG")
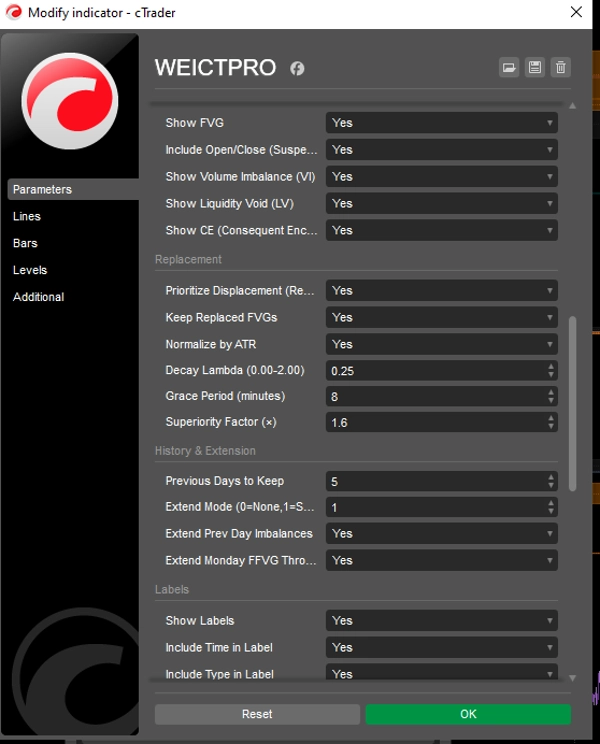
พารามิเตอร์สำคัญ
พารามิเตอร์
คำอธิบาย
แสดง FVG/VI/LV
สลับประเภทความไม่สมดุลเฉพาะที่คุณต้องการติดตาม
ความทึบของกล่อง
ปรับความ "ทึบ" ของพื้นที่ที่ถูกแรเงาบนชาร์ตของคุณ
ขยายแท่งเทียน
จำนวนแท่งเทียนในอนาคตที่กล่องควรฉายภาพ
โซนเวลา
ตั้งค่าเป็นเวลามาตรฐานตะวันออกเพื่อความแม่นยำของช่วงเวลาการซื้อขายไม่ว่าจะใช้เวลาของเซิร์ฟเวอร์โบรกเกอร์ใด
คำแนะนำทางเทคนิค
- กรอบเวลา: ใช้ได้ดีที่สุดใน M1 ถึง M15 ในกรอบเวลาที่สูงกว่า (H1+) ช่วงเวลาสั้นเกินไปที่จะจับความไม่สมดุล "ครั้งแรก" ได้อย่างน่าเชื่อถือ
- การใช้งาน: พื้นที่เหล่านี้มักทำหน้าที่เป็น "แม่เหล็ก" สำหรับราคา เทรดเดอร์จะมองหาราคากลับมายังกล่องเหล่านี้ (โดยเฉพาะระดับ CE) เพื่อเข้าทำรายการก่อนที่จะดำเนินไปในทิศทางเดิม