
Beschreibung
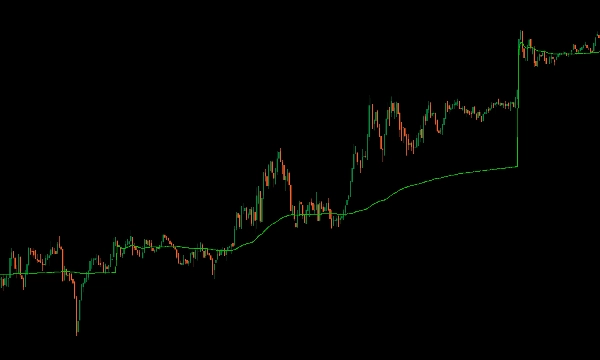
Vorstellung des VWAP Indikators für cTrader, der die volle Funktionalität des Volume Weighted Average Price von TradingView auf Ihre Handelsplattform bringt.
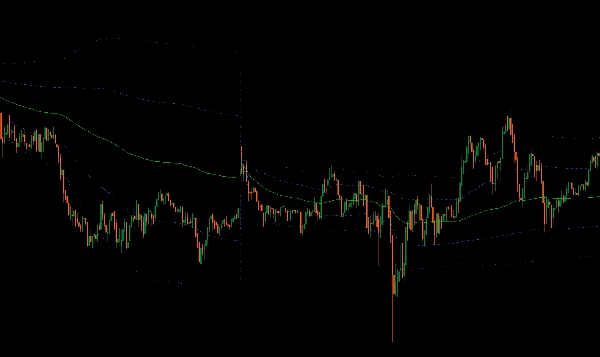
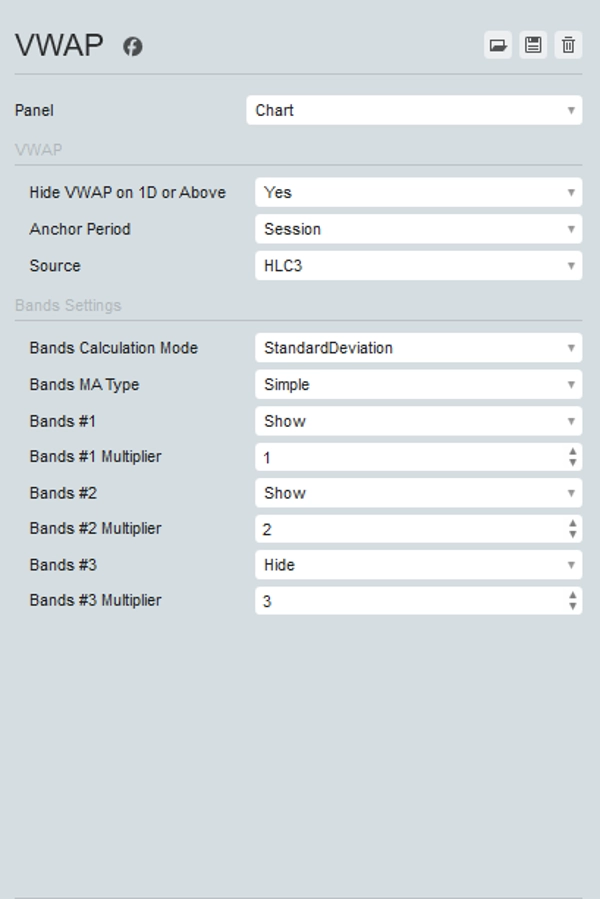
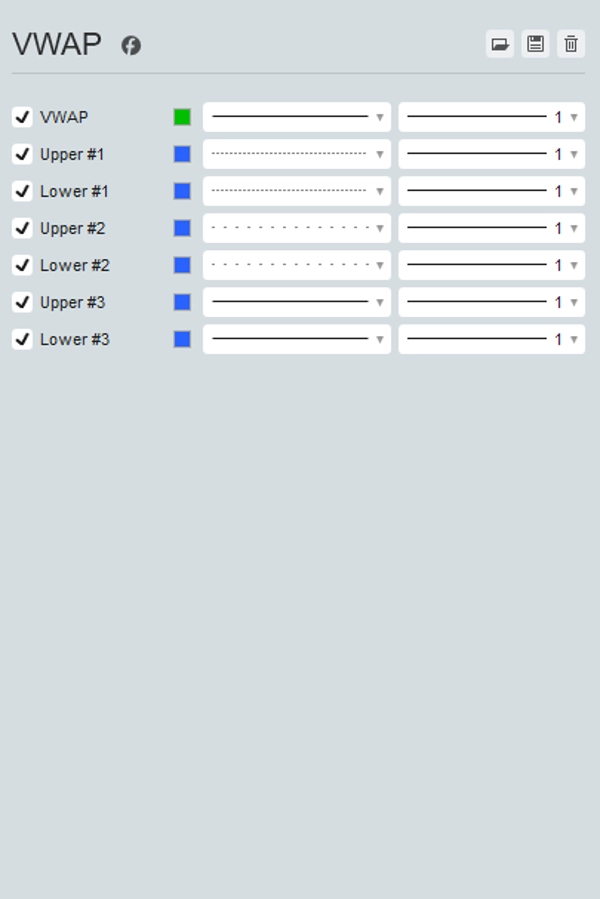
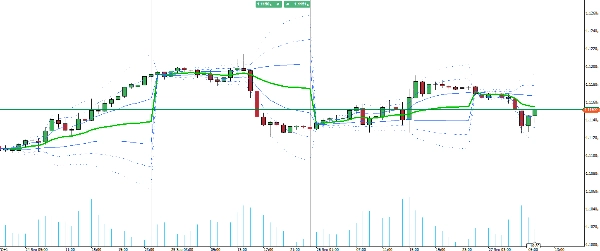
Dieses umfassende Tool ermöglicht es Ihnen, Ihren Ankerzeitraum (Session, Woche, Monat, Quartal, Jahr) auszuwählen und aus verschiedenen Preisquellen zu wählen, darunter Open, High, Low, Close, HL2, HLC3, OHLC4 und HLCC4. Zusätzlich kann es bis zu drei Standardabweichungen obere und untere Bänder anzeigen und bietet so einen vollständigen Überblick über die Preisverteilung.
Der VWAP-Indikator aktualisiert sich in Echtzeit mit Tick-Daten, sodass Sie die genauesten und aktuellsten Einblicke für Ihre Handelsentscheidungen erhalten. Verbessern Sie Ihre Handelsstrategie mit dem vielseitigen und leistungsstarken VWAP-Indikator in cTrader.
Zusammenfassung
Kundenbewertungen
5 | 67 % | |
4 | 33 % | |
3 | 0 % | |
2 | 0 % | |
1 | 0 % |


