
Mô tả
THUẬT TOÁN này là một công cụ kỹ thuật tiên tiến 🔧 được thiết kế để tự động phát hiện các mẫu giá hình học (Mẫu Harmonic) và cấu trúc thị trường dựa trên hành động giá. Mục tiêu chính của nó là xác định các vùng đảo chiều xu hướng tiềm năng có xác suất cao 📍.
https://chartshots.spotware.com/c/693330cd99c57
Thuật toán này làm gì?
Thuật toán quét biểu đồ trong thời gian thực 🔍 tìm kiếm các hình thành giá cụ thể. Nó hoạt động trên hai cấp độ:
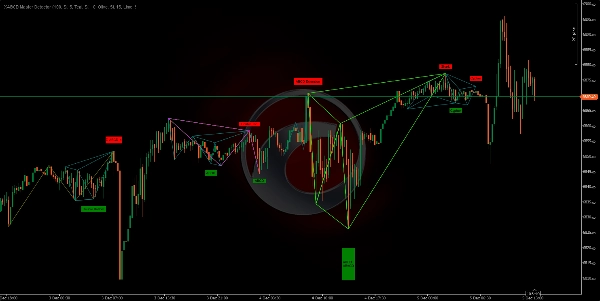
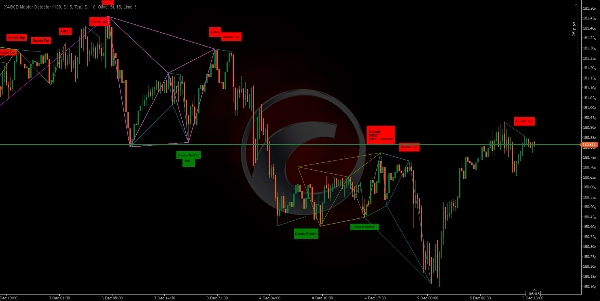
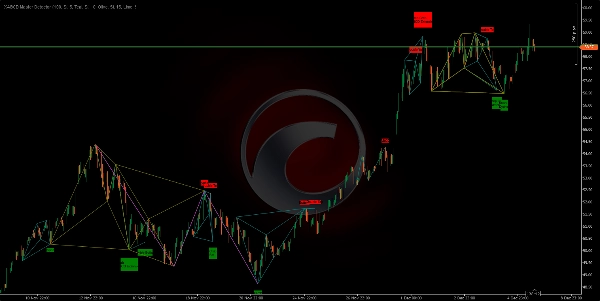
- Bản đồ cấu trúc (ZigZag): Đầu tiên, nó đơn giản hóa nhiễu thị trường bằng cách vẽ các đường "ZigZag" kết nối các đỉnh và đáy liên quan (điểm xoay). Nó sử dụng đồng thời lên đến 4 độ dài khác nhau 📏 để nắm bắt cả xu hướng nhỏ (ngắn hạn) và lớn (dài hạn).
- Nhận diện mẫu: Khi các điểm xoay này (các điểm A, B, C, D, X) được xác định, thuật toán đo khoảng cách và tỷ lệ giữa chúng. Nếu các tỷ lệ này phù hợp với các quy tắc toán học của các mẫu giao dịch cổ điển (như Fibonacci), chỉ báo sẽ vẽ mẫu và cảnh báo người dùng 🚨.
Nó dùng để làm gì?
Nó giúp loại bỏ tính chủ quan khi vẽ các mẫu phức tạp và tiết kiệm thời gian phân tích ⏳. Thay vì đo thủ công từng mức Fibonacci thoái lui và mở rộng, chỉ báo sẽ tự động làm điều đó để:
- Phát hiện đảo chiều: Tìm điểm mà giá có thể quay đầu (từ tăng sang giảm hoặc ngược lại). 🔄
- Xác định điểm vào lệnh: Báo hiệu các vùng chính xác (vùng "Vùng đảo chiều tiềm năng") để vào thị trường. 🎯
- Xác nhận phân tích: Làm yếu tố bổ sung cho chiến lược hỗ trợ/kháng cự của bạn.
Logic đằng sau các phép tính
Cốt lõi của chỉ báo dựa trên Tỷ lệ Fibonacci và sự đối xứng thị trường ⚖️. Thuật toán kiểm tra các quy tắc nghiêm ngặt cho mỗi mẫu. Ví dụ, để xác nhận một mẫu "Gartley", thuật toán sẽ tính toán bên trong:
- Nếu mức thoái lui của điểm B so với đoạn XA chính xác (hoặc rất gần) với 0.618.
- Nếu phép chiếu của điểm D đáp ứng các tỷ lệ cụ thể.
Chỉ báo cho phép một biên độ sai số nhỏ (có thể cấu hình) bởi vì thị trường hiếm khi hoàn hảo đến từng pip. Nó cũng tính toán tỷ lệ Rủi ro/Lợi nhuận trước khi hiển thị một mẫu.
Các mẫu mà nó phát hiện:
https://chartshots.spotware.com/c/6933314cb9fa1
- Cổ điển: Đỉnh đôi và Đáy đôi. 🏔️🏞️
- Harmonics: Gartley, Bat 🦇, Butterfly 🦋, Crab 🦀, Deep Crab, Shark 🦈, Cypher.
- Cấu trúc ABCD: ABCD cổ điển, AB=CD, ABCD mở rộng.
- Ngoại lai: Three Drives, 5-0.
https://chartshots.spotware.com/c/6933317ae4324
Cách sử dụng?
Thiết lập trực quan:
- Bạn sẽ thấy các đường màu sắc kết nối các đỉnh và đáy.
- Khi một mẫu hoàn chỉnh, một hình học màu sắc và một nhãn với tên mẫu (ví dụ, "Gartley", "Đỉnh đôi") sẽ xuất hiện.
- Nhãn màu xanh lá cây: Chỉ ra mẫu tăng giá (tìm mua). 📈
- Nhãn màu đỏ: Chỉ ra mẫu giảm giá (tìm bán). 📉
Diễn giải:
- Không giao dịch mù quáng với mọi nhãn. Sử dụng nó như một tín hiệu cảnh báo.
- Khi một mẫu xuất hiện, chờ giá phản ứng tại vùng D (điểm cuối của mẫu).
- Tìm xác nhận bổ sung (như nến đảo chiều Nhật hoặc phân kỳ RSI) trước khi vào lệnh.
Các điều chỉnh chính:
- Bạn có thể kích hoạt hoặc vô hiệu hóa các mẫu cụ thể nếu bạn chỉ muốn giao dịch một số mẫu (ví dụ, chỉ "Bat" và "Gartley"). ✅
- Bạn có thể điều chỉnh độ nhạy của ZigZags để thấy các chuyển động nhanh hơn hoặc các xu hướng chậm hơn. ⚙️
🏆 Hơn 10.000 Nhà giao dịch Tin tưởng Bộ Thuật Toán 25+ của Chúng tôi! 🏆
Từ Cấu trúc Thị trường & Thanh khoản đến Hệ thống Thoát Thông minh & Công cụ Dự đoán - chúng tôi đã xây dựng MỌI công cụ bạn cần để có sự nhất quán.
👉 Truy cập Tất cả 25+ Hệ thống ĐÃ KIỂM CHỨNG:
_______________________________________________
📌 Chỉ báo Cấu trúc Thị trường
· 🔄 Phân tích Cấu trúc Thị trường Động của các Điểm Xoay
· 🧱 Order Block
· ⛓️ BOS & CHOCH
· 🧠 ICT Power of 3
_______________________________________________
🔚 Hệ thống Thoát Thông minh
· 📍 Thuật toán Thông minh Theo dõi
_______________________________________________
📐 Chỉ báo ZigZag
· 🔍 Dự đoán Thanh khoản Giá ZigZag
· 🧭 ZigZag Cấu trúc Hỗ trợ & Kháng cự
· ➖ ZigZag
· 🎯 Bộ Theo dõi Cực điểm Zig-Zag
_______________________________________________
🧱 Chỉ báo Hỗ trợ & Kháng cự
· 🟩 Đường Hỗ trợ & Kháng cự Xu hướng Thông minh
· 🧱 Tất cả các Mức Hỗ trợ và Kháng cự
_______________________________________________
📊 Chỉ báo Xu hướng & Kênh
· 📊 Supertrend
· ⚡Bộ Phân tích Xu hướng Động lượng
· ⭐ KÊNH SSL CAO CẤP
_______________________________________________
💧 Công cụ Khối lượng & Thanh khoản
· 🔥 Bản đồ Nhiệt POC Khối lượng
· 🔍 Khoảng trống Giá Trị Công bằng Động lượng
· 🕒 Phiên Khoảng trống Giá trị Công bằng
_______________________________________________
⚡ Chỉ báo Động lượng & RSI
· 🔎 Bộ Theo dõi Định hướng Nến Đa cấp
Tracker
_______________________________________________
🔮 Công cụ Dự đoán & Chiếu dự báo
· 📐 Dự đoán dựa trên Linreg & ATR
· 📏 Hồi quy Tuyến tính Fibonacci Đa khung thời gian
· 📈 Máy Chiếu Dòng Thị trường Dựa trên Khối lượng_________________________
_________________________________________________________________________________________________
_________________________________________________________________________________________________
KÍCH HOẠT KÊNH RSI: 📶
Nó là gì: Một chỉ báo tính toán RSI(kỳ) và đánh dấu trực quan các vùng động lượng khi RSI vượt qua các ngưỡng quá mua/quá bán (mặc định 70/30). ✅
https://chartshots.spotware.com/c/69278f8b6d973
Logic: Khi một ngưỡng bị vượt qua, nó tạo ra một "vùng" dựa trên mức cao/thấp của nến tại thời điểm vượt ngưỡng. Sau đó: 🧠
- Tô màu các nến bên trong vùng đó.
- Vẽ một kênh (cao, thấp, giữa).
- Đánh dấu điểm vượt ngưỡng trên bảng RSI bằng một vòng tròn và nhãn.
Vùng này kéo dài chính xác MinZoneDuration thanh. ⏱️
Tín hiệu rõ ràng:
- Vượt ngưỡng trên mức Quá mua → khởi tạo một vùng tăng giá. 🟢
- Vượt ngưỡng dưới mức Quá bán → khởi tạo một vùng giảm giá. 🔴
Vùng này là một khu vực quan tâm, không phải là một lệnh.
https://chartshots.spotware.com/c/69278fb274e0b
Cách sử dụng (nhanh):
- Chờ vùng hình thành. 🎯
- Xác nhận với hành động giá (phá vỡ/bác bỏ từ các đường kênh).
- Vào lệnh với stop loss ngoài vùng và mục tiêu tại đường giữa kênh hoặc tỷ lệ Rủi ro/Lợi nhuận đã định.
https://chartshots.spotware.com/c/69278fe76237b
Các tham số chính: ⚙️
- Kỳ RSI (14)
- Quá mua (70)
- Quá bán (30)
- MinZoneDuration (15)
- Màu sắc có thể cấu hình 🎨
Tóm tắt
The algorithm recognizes classic and complex patterns—including Double Top/Bottom, Gartley, Bat, Butterfly, Crab, Deep Crab, Shark, Cypher, ABCD structures, and exotic patterns like Three Drives and 5-0—by measuring distances and Fibonacci ratios between pivot points. Upon pattern completion, it visually displays colored geometric figures and labels indicating bullish (green) or bearish (red) signals.
Users can customize pattern detection and ZigZag sensitivity to suit their trading preferences. The indicator supports various markets such as Forex, commodities, indices, stocks, and cryptocurrencies, including symbols like EURUSD, GBPUSD, BTCUSD, XAUUSD, NAS100, and USDJPY.
XABCD Master Detector aims to reduce subjectivity and save analysis time by automatically calculating Fibonacci retracements, extensions, and theoretical risk/reward ratios. It serves as an alert tool to detect reversals, identify entry points, and provide additional confluence to existing support/resistance strategies.
Đánh giá của khách hàng
5 | 100 % | |
4 | 0 % | |
3 | 0 % | |
2 | 0 % | |
1 | 0 % |


