
Mô tả
🚀 Hơn 10.000 nhà giao dịch đã sử dụng các chỉ báo TOP của chúng tôi🏆
Khám phá lý do tại sao các chuyên gia chọn chúng tôi – những công cụ mạnh mẽ nhất trên cTrader (chỉ báo, thuật toán và cBots) đang chờ bạn.
👉 Nhận tất cả các hệ thống TOP của chúng tôi tại đây:
_______________________________________________
_______________________________________________
📌 Chỉ báo Cấu trúc Thị trường
· ✅ AdvancedMarket Structure: Bos, Choch, SwinLevels, Order Blocks, Market Structure& Liquidity Finder
· 🔄 Dynamic Market StructureAnalysis of Turning Points
· 🧱 Order Block
· ⚖️ Market Imbalance
· ⛓️ BOS & CHOCH
· 🧠 ICT Power of 3
______________________________________________________________-
Store cBots : 🧠 Gold & BTC BreakoutSession Pivots 🧠
_______________________________________________
🔚 Hệ thống Thoát Thông minh
· 📍 Thuật toán Thông minh Theo dõi
_______________________________________________
📐 Chỉ báo ZigZag
· 🔍 Dự đoán Thanh khoản Giá ZigZag
· ➖ ZigZag
· 🎯 Bộ Theo dõi Cực điểm Zig-Zag
_______________________________________________
🧱 Chỉ báo Hỗ trợ & Kháng cự
· 🟩 Dòng Hỗ trợ & Kháng cự SmartTrend
· 🧱 Tất cả các Mức Hỗ trợ và Kháng cự
_______________________________________________
📊 Chỉ báo Xu hướng & Kênh
· 📊 Supertrend
· ⚡Bộ Phân tích Xu hướng Động lượng
· ⭐ KÊNH SSL CAO CẤP
_______________________________________________
💧 Công cụ Khối lượng & Thanh khoản
· 🔥 Bản đồ Nhiệt POC Khối lượng
· 🔍 Khoảng cách Giá Trị Công bằng Động lượng
· 🕒 Phiên Khoảng cách Giá Trị Công bằng
_______________________________________________
⚡ Chỉ báo Động lượng & RSI
· 🔎 Bộ Theo dõi Định hướng Nến Đa cấp
_______________________________________________
🔮 Công cụ Dự đoán & Dự báo
· 📐 Dự đoán dựa trên Linreg& ATR
· 📏 Hồi quy Tuyến tính Fibonacci Đa khung thời gian
· 📈 Máy chiếu Dòng chảy Thị trường dựa trên Khối lượng
_________________________________________________________________________________
_________________________________________________________________________________
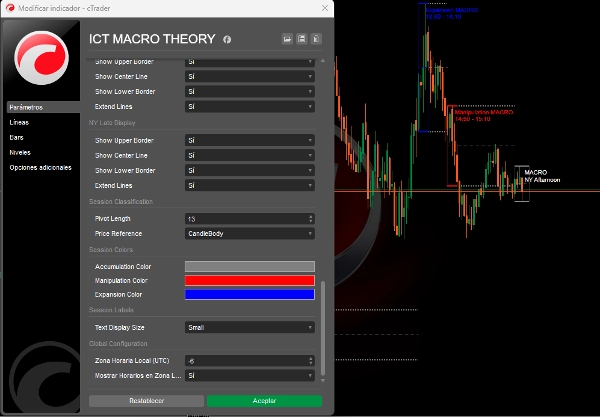
🌐 LÝ THUYẾT ICT MACRO
⚠️ LƯU Ý QUAN TRỌNG: Chỉ báo này chỉ hoạt động trên các khung thời gian dưới 5 phút.
Giải thích về các kỳ ICT Macro
Các kỳ ICT macro về cơ bản là các khoảng thời gian ngắn trong đó thuật toán tìm kiếm thanh khoản hoặc điều chỉnh giá cho các khoảng trống giá trị công bằng. Nền tảng của các macro ICT này nằm trong lý thuyết thời gian và giá của ICT.
Một macro là "một chuỗi ngắn các lệnh tạo ra một sự kiện trong việc truyền giá", như được ICT tự định nghĩa.
Các macro ICT không phải là chiến lược giao dịch hoàn chỉnh, nhưng chúng có thể thêm sự đồng thuận cho các giao dịch của bạn và tối đa hóa lợi nhuận. Chúng xảy ra trong các phiên London, New York, giữa ngày và buổi chiều.
🔮 Triển khai Nâng cao của Lý thuyết Thời gian ICT Macro:
Kết nối Trực tiếp với Các khái niệm ICT:
Mã thực hiện chính xác 3 loại macro ICT được mô tả trong lý thuyết, sử dụng logic phân loại dựa trên:
- Phân tích Cấu trúc Thị trường:
-
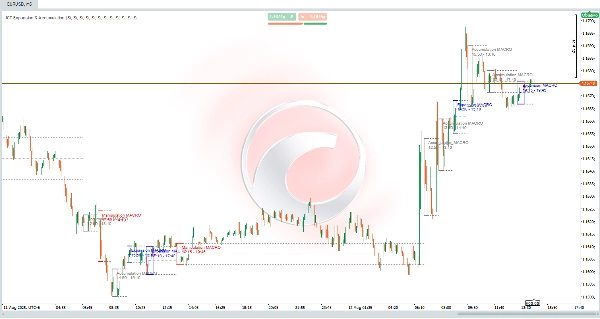
- Phát hiện các Phiên Macro
- Ghi lại thời gian ICT chính xác (London 02:33, NY 09:50, v.v.).
- Phát hiện các thay đổi cấu trúc trước và trong mỗi phiên macro.
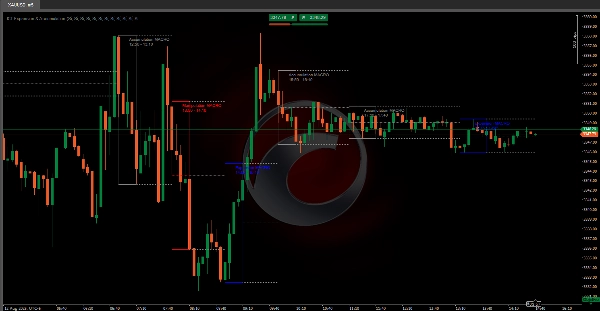
- Tự động phân loại thành:
-
- 🟥 Thao túng: Khi giá quét thanh khoản ở cả hai phía (mua/bán).
- 🟦 Mở rộng: Các chuyển động định hướng lấy thanh khoản ở một phía (phù hợp với xu hướng).
- 🟩 Tích lũy: Phạm vi hẹp nơi giá "tích lũy" thanh khoản.
- Mức khóa Mở rộng:
-
- Vẽ các mức cao/thấp của mỗi phiên macro.
- Tính toán và mở rộng giá trung bình (điểm giữa) đến phiên tiếp theo.
- Các mức này hoạt động như hỗ trợ/kháng cự động (Thiết yếu trong ICT!).
- Phát hiện Thanh khoản Thời gian Thực:
-
- Sử dụng dữ liệu 1 phút để xác định các điểm xoay chính xác (giống như trên các khung thời gian thấp hơn).
Các Cải tiến & Cập nhật Sắp tới:
- Phát hiện Quét Thanh khoản: Sẽ xác định các lần quét thanh khoản trước đó (cao/thấp ngày/tuần trước).
- Khoảng trống Giá trị Công bằng (FVG): Sẽ phát hiện và hiển thị các khoảng trống giá trị công bằng.
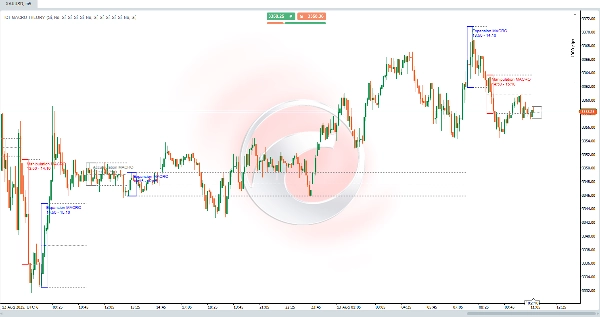
📊 Ví dụ Thực tế về ICT
Kịch bản Mở cửa NY (09:50-10:10):
- Trước phiên: Giá quét thanh khoản bên mua (đáy cục bộ).
- Trong phiên:
-
- Phân loại là 🟥 THAO TÚNG.
- Giá chuyển sang cấu trúc giảm.
- Sau phiên:
-
- Các đường mở rộng đánh dấu kháng cự tại đỉnh phiên.
- Giao dịch bị từ chối tại vùng với tỷ lệ RR 1:3.
✅ Trung thành với Nguyên tắc ICT:
"Macros không phải là chiến lược hoàn chỉnh nhưng thêm sự đồng thuận bằng cách xác định nơi thuật toán sẽ tìm kiếm thanh khoản."
Tóm tắt
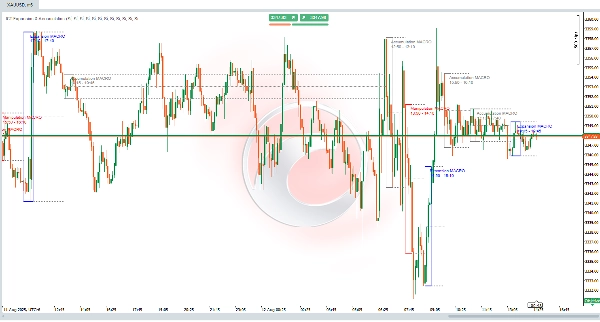
The indicator analyzes market structure and detects key macro sessions—London, New York, midday, and afternoon—recording exact ICT times. It classifies price behavior into three types of macros: Manipulation (price sweeps liquidity on both sides), Expansion (directional movement aligned with trend), and Accumulation (tight range where price accumulates liquidity). It also draws and extends session highs, lows, and average price levels to act as dynamic support and resistance.
Using 1-minute data, ICT MACRO THEORY detects precise pivots for real-time liquidity identification. While not a complete trading strategy, it adds confluence to trades by highlighting where algorithms seek liquidity. Planned updates include detection of liquidity sweeps and visualization of fair value gaps.
This tool is intended for traders seeking to incorporate ICT macro time concepts into their analysis for enhanced market structure insight and liquidity detection on very short timeframes.


![Logo "[Hamster-Coder] Bollinger Bands"](https://cdn.ctrader.com/image/webp/21d8e5d6-fb11-4bac-b9ee-cd05c2b76804_30327)


![Logo "[Stellar Strategies] Ultimate Trend & Momentum Dashboard"](https://cdn.ctrader.com/image/webp/e9a9c9e9-4b6c-4bc0-9988-4c4768a23b6c_30290)


