present
Sign up and get $50 off your first purchase
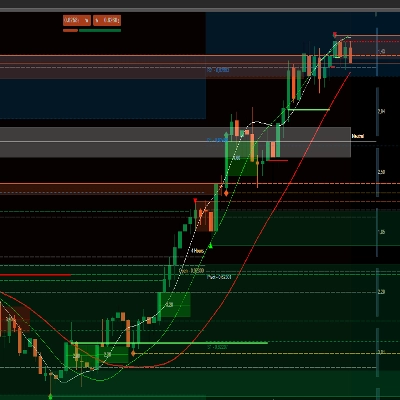
Trading product for EMA_RTH Indicator, image 1
EMA_RTH
Indicator
82 downloads
Version 1.0, May 2025
Windows, Mac
Since 19/05/2025
82
Free installs

Description

EMA calculated on a custom period/session of your choosing

Summary

AI summary
EMA_RTH is a technical indicator that calculates the Exponential Moving Average (EMA) based on a custom period or trading session defined by the user. This flexibility allows traders to tailor the EMA calculation to specific market hours or timeframes relevant to their trading strategy. The indicator focuses on providing EMA values derived from user-selected sessions rather than standard fixed periods, enabling more precise analysis aligned with particular trading sessions.
Indicator profile

Customer reviews

0.0
Reviews: 0
Customer reviews
No reviews for this product yet. Already tried it? Be the first to tell others!

Discussion

FAQ

Products available through cTrader Store, including trading bots, indicators and plugins, are provided by third-party developers and made available for informational and technical access purposes only. cTrader Store is not a broker and does not provide investment advice, personal recommendations or any guarantee of future performance.

More from this author
cBot
GBPUSD
NAS100
NAS100 Gap-and-Go is an institutional-quality systematic trading algorithm that identifies and trades gap continuation

You may also like

Indicator
Forex
EURUSD
+4
Check the correlations between dozens of assets in one elegant display.
Indicator
Grid
Prop
+16
Those who are involved in trading know how important it is to take into account the previous session. With Order Block
Indicator
EMA
AI-assisted
+1
Multi EMA Timeframes lets you stay on your chart and see the exact EMA from any timeframe you choose — up to 5 at once.
Indicator
Scalping
Bússola para Decisões de Trading Precisas e Eficientes!
Indicator
ATR
Key Levels
+3
Automated session boxes, live ADR volatility meter & institutional key levels with glassmorphic HUD.
Indicator
Volume
Order Block
+4
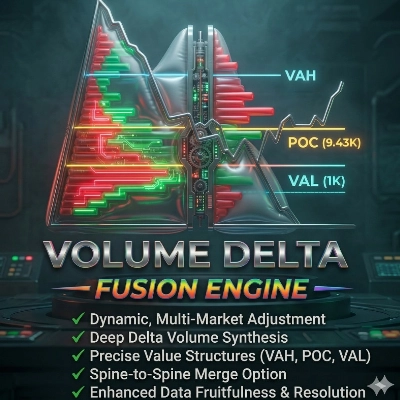
Advanced Pro Volume Profile: Double Back-to-Back, Institutional Dynamic, Fixed Range & Order Flow
Indicator
ATR
Wedge
+2
Strong Supertrend Turn Market Movement into a Clear Map Market analysis
Indicator
RSI
Signal
+2
The QQE indicator is a technical analysis tool designed to identify potential trend changes and trading signals 📈📉
Indicator
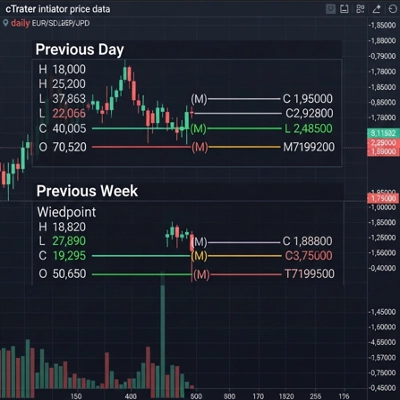
The Weekly Daily Levels indicator shows the OHLC, and mid-point prices for the previous day and week.
Indicator
Doji
Volume
+5
Instantly spot high-liquidity institutional moves with clean, non-obtrusive triangle alerts on cTrader charts.
Indicator
Prop
Forex
+4
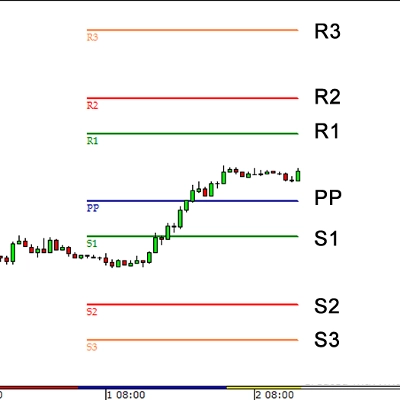
Pivot Points Standard — All-in-One Multi-Timeframe Pivot Indicator for cTrader
Indicator
Fair Value Gap
Liquidity Grab
+2
PRO Liquidity Sweep + FVG Combo detector with custom Gold/Blue signals & alerts
Indicator
RSI
Signal
+1
Multi-timeframe version of the Quantitative Qualitative Estimation (QQE) indicator.
Indicator
XAUUSD
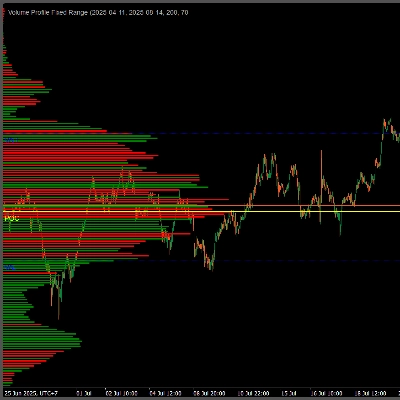
Professional Volume Profile Indicator - Shows volume distribution, POC, Value Areas & Buy/Sell pressure.
Indicator
[Hamster-Coder] Pivot Points (Multi Time Frame)
Indicator
ATR
RSI
+7
Track the Movement of Market Assets with an Oscillator Scanner in Real-Time!
Indicator
RSI
RSI on the main chart with 45/55 momentum levels, overbought/oversold levels, averaged RSI, and multi-timeframe support.
Indicator
ATR
Key Levels
+1
See how price reaches your level with clear states, ATR distance, touch count, level wear and spread context.

Price

Since 19/05/2025
82
Free installs