CicloQuatroVelas
Indicator
105 downloads
Version 1.0, Aug 2025
Windows, Mac
Description
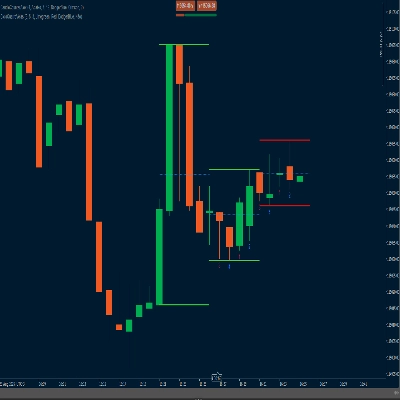
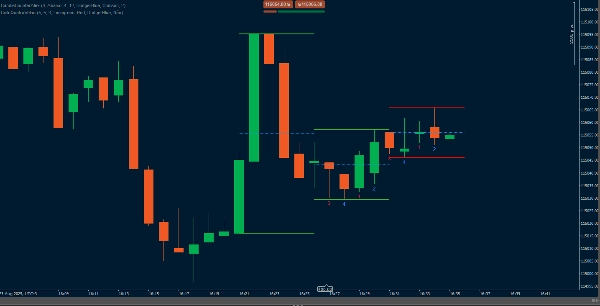
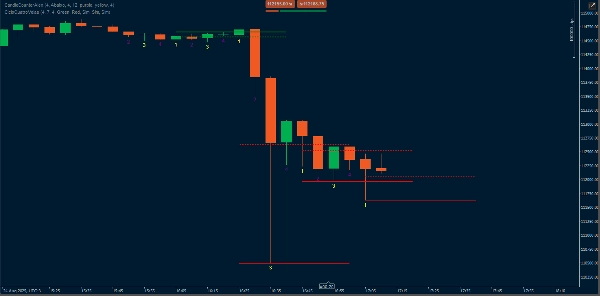
O Ciclo 4 Velas é um indicador desenvolvido para destacar de forma clara a dinâmica de pequenos ou grandes ciclos no gráfico.
A cada sequência de 4 velas ou mais , o indicador marca automaticamente as máximas , mínimas e 50% com linhas horizontais, proporcionando uma leitura simples e objetiva da movimentação do preço.
🔹 Principais recursos:
- Identificação automática dos ciclos de 4 velas ou mais
- Linhas horizontais desenhadas na máxima e mínima de cada ciclo.
- Remoção automática de ciclos antigos, evitando poluição visual no gráfico.
- Ferramenta ideal para quem busca disciplinar a leitura de tendências curtas.
- Importante: adicionei a linha de 50% de cada amplitude para facilitar a leitura. Junte esse indicador com o contador de velas. Ficou show. !!!
- Agora você tem três parâmetros extras no painel do indicador:
- Excluir Extremidade Anterior (mantive como antes).
- Mostrar Máxima/Mínima → ON/OFF.
- Mostrar Linha 50% → ON/OFF.
Assim você pode rodar só com a linha de 50%, ou só com máxima/mínima, ou com todos juntos.
💡 Esse indicador é útil tanto para estudos de price action quanto para estratégias baseadas em microtendências.
Summary
Indicator profile
Customer reviews
0.0
Reviews: 0
Customer reviews
No reviews for this product yet. Already tried it? Be the first to tell others!
Discussion
FAQ
Forex
Commodities
Crypto
Stocks
Products available through cTrader Store, including trading bots, indicators and plugins, are provided by third-party developers and made available for informational and technical access purposes only. cTrader Store is not a broker and does not provide investment advice, personal recommendations or any guarantee of future performance.
More from this author


!["[Stellar Strategies] Smart ADX" logo](https://cdn.ctrader.com/image/webp/af13b084-b6f6-41db-b7bc-c7e688b57b05_36929)


!["Gaussian Channel [Iridio Capital]" logo](https://cdn.ctrader.com/image/webp/7c039209-5573-4a54-a072-f9528b503103_41960)


Price
Since 18/08/2025
1
Sales
105
Free installs