
Description
📈 Stochastic RSI
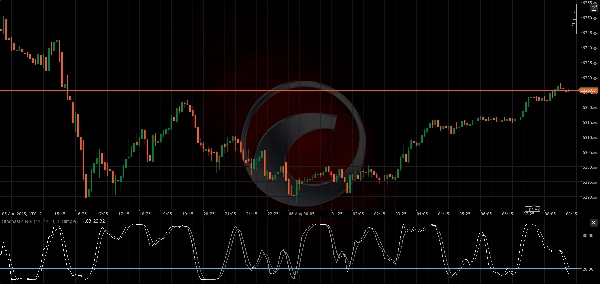
The Stochastic RSI indicator is a momentum oscillator that applies the Stochastic formula to RSI values rather than price, making it a second-derivative indicator. It is particularly useful for identifying overbought and oversold conditions with higher sensitivity than the standard RSI.
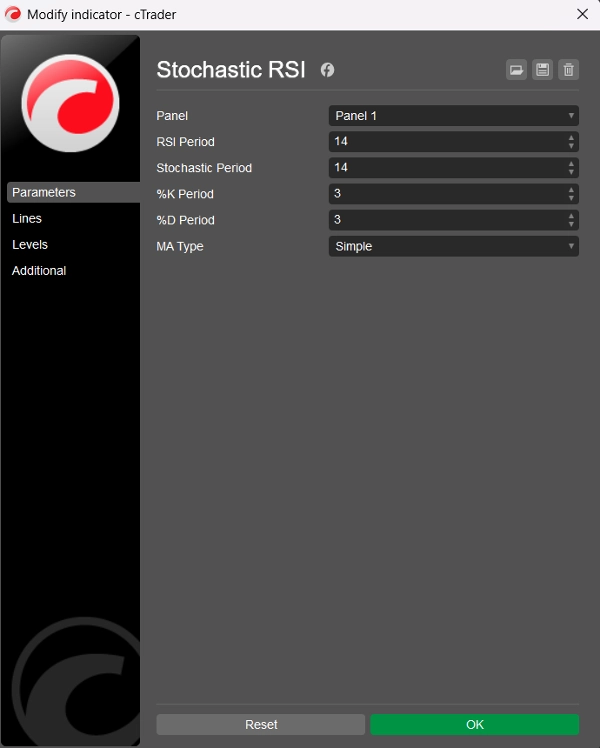
🛠️ Parameters
RSI Period: The lookback period used to calculate the base RSI (default = 14)
Stochastic Period: The lookback period applied to RSI values to compute Stochastic RSI (default = 14)
%K Period: The smoothing period for the %K line (default = 3)
%D Period: The smoothing period for the %D line (default = 3)
MA Type: Moving average type for smoothing: Choice of 11 types (default = Simple)
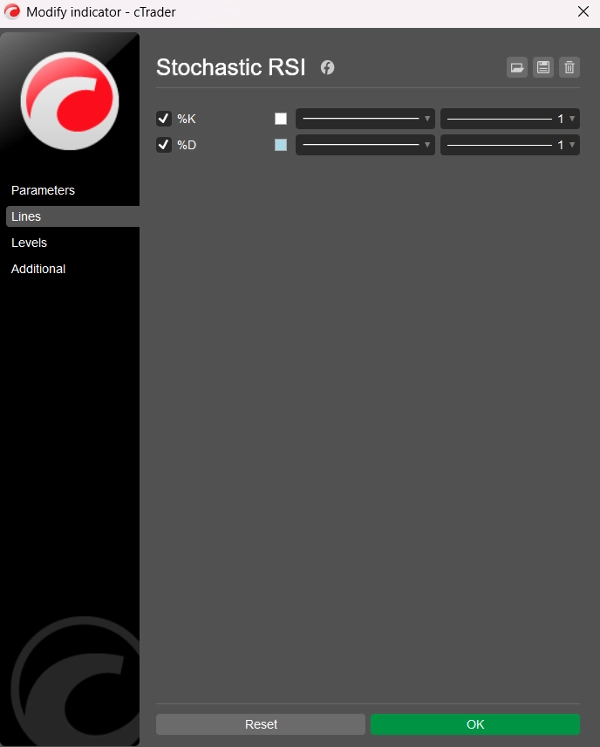
📊 Output Lines
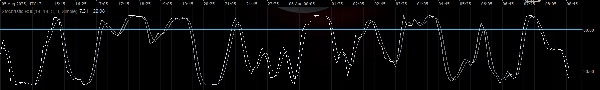
- %K Line: Smoothed Stochastic RSI (white)
- %D Line: Smoothed moving average of %K (lightblue)
Both lines oscillate between 0 and 100, allowing for clear overbought and oversold readings.
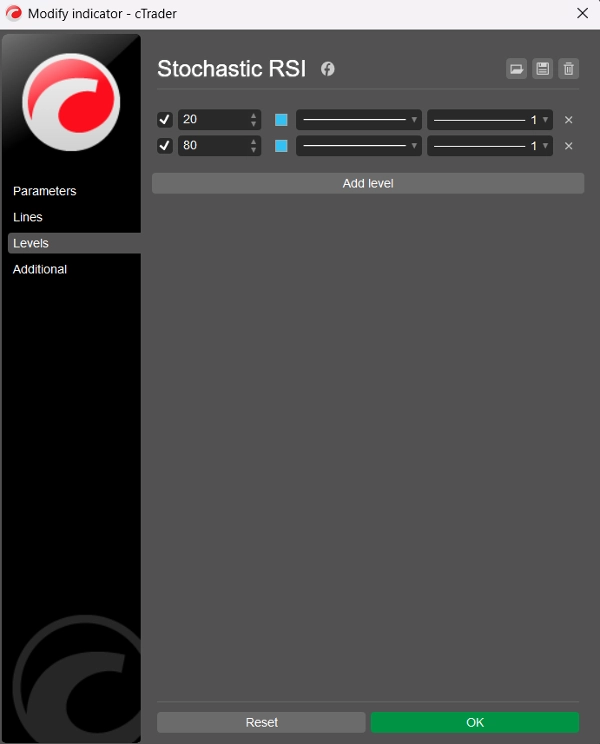
⚠️ Suggested Levels
Although the indicator does not display static levels by default, users are recommended to add these manually via the “Levels” tab in cTrader:
- Level 80 → Overbought
- Level 20 → Oversold
These levels work similarly to the traditional Stochastic Oscillator but applied to RSI behavior, making the signals sharper and often faster.
🧠 How to Use
- Overbought (>80): May indicate price is overextended to the upside — potential for reversal or consolidation.
- Oversold (<20): May signal price is oversold — possible bounce or trend reversal.
- %K and %D Crossovers: Can be used similarly to Stochastic or MACD — a bullish crossover below 20 or bearish crossover above 80 may be actionable.
🏷️ Notes
- Built for cTrader using C# and the Automate API
- Clean, efficient, and customizable with 11 MA types
- Code and logic by BlueRocketBots & ChatGPT (OpenAI)
- Clean code (total 99 lines; 54 lines code, 27 lines text, 18 lines empty)
- V2 improved version
- For free!
Summary
Key parameters include the RSI Period (default 14), Stochastic Period (default 14), %K and %D smoothing periods (default 3 each), and a choice among 11 moving average types for smoothing (default is Simple). The indicator outputs two lines: the %K line (smoothed Stochastic RSI) and the %D line (smoothed moving average of %K), both oscillating between 0 and 100.
Suggested manual levels for interpretation are 80 (overbought) and 20 (oversold). Traders may use these levels along with %K and %D crossovers to identify potential price reversals or consolidations. For example, a bullish crossover below 20 or a bearish crossover above 80 can signal actionable market moves.
The indicator is implemented in clean, efficient C# code using the Automate API, allowing customization and integration within cTrader.


!["High-Low Divergence [Iridio Capital]" logo](https://cdn.ctrader.com/image/webp/443c4661-7abb-40f1-842f-4b6ec560649b_40914)


!["[Stellar Strategies] QQE" logo](https://cdn.ctrader.com/image/webp/e702104a-874c-4b39-97dd-fb34518d1015_27712)