説明
Pinescriptlabs ストア インジケーター: Pinescriptlabs ストア cBots : (cBot) Gold & BTC ブレイクアウトセッションピボット(新着)
高度なマーケット構造: Bos、Choch、SwinLevels、オーダーブロック、 マーケット構造&流動性ファインダー (新着)
トレーリングスマートアルゴリズム (新着)
📊 マーケットフロープロジェクション:
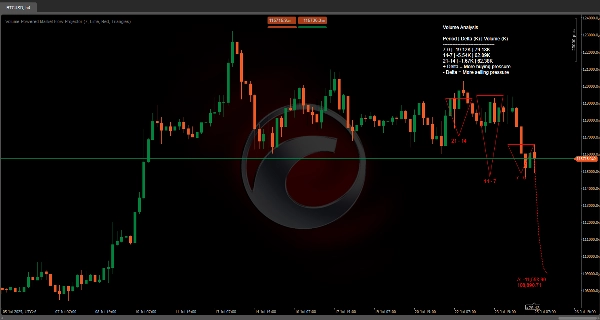
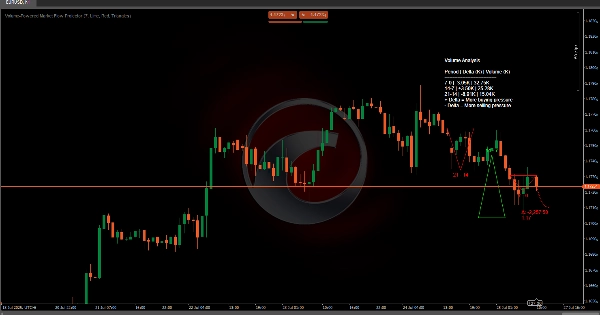
この FutureTrend インジケーターは、複数の時間軸にわたる価格とボリュームデータを統合して、市場の動向を動的に分析および予測するよう設計されています。主な機能は以下の通りです。
⏳ 3期間分析
📈 連続する3つの期間(Period パラメーターで定義)にわたる平均価格(高値と安値)とデルタボリューム(買い圧力と売り圧力の差)を計算します。
🔍 この統合された過去の動きのビューは、支配的なトレンドや市場行動の変化を特定するのに役立ちます。
🚀 将来のトレンドライン予測
📊 3つの分析期間からのデルタボリュームの加重平均を使用して、市場の可能な方向性を反映した 将来のトレンドライン を予測します。
🛠️ 平滑化係数を用いて動的に調整し、極端な予測を避けます。
🔷 形状の視覚的表現
🎨 過去のデータは、各期間のボリュームと価格範囲の変化を示す 幾何学的形状(三角形、円、またはボックス)で視覚的に表現されます。
🔴🟢 割り当てられた色(UpColor と DownColor)は、強気または弱気の支配的なトレンドを示し、迅速な解釈を可能にします。
🏷️ 平均デルタボリューム&将来価格ラベル
📍 予測されたトレンドラインの終端に、平均デルタボリュームと推定将来価格を表示する ラベル があり、潜在的な価格変動とトレンドの強さの重要な参照を提供します。
📋 ボリュームデータテーブル
📑 3つの分析期間の合計ボリュームとデルタ差を詳細に分解した テーブル を提供します。
📊 これによりトレーダーはボリュームデータを迅速に比較し、市場の文脈を解釈し、将来のトレンド予測を支援できます。
🔮 方向性
ボリューム と 価格データ を組み合わせることで、このインジケーターはトレンドの強さと今後の期間における市場行動の潜在的な変化の両方を予測する強力なツールを提供します。
概要
The indicator projects a future trendline based on a weighted average of delta volumes from the analyzed periods, dynamically adjusted with smoothing factors to prevent extreme predictions. Historical data is visually represented using geometric shapes—such as triangles, circles, or boxes—that illustrate volume and price range evolution for each period. Colors indicate prevailing trends, with distinct hues for bullish and bearish conditions.
At the end of the projected trendline, a label displays the average delta volume and estimated future price, providing a reference for potential price movements and trend strength. Additionally, a detailed volume data table breaks down total volumes and delta differences for the three periods, supporting market context interpretation and trend projection. By combining volume and price data, this tool aids in predicting trend strength and potential market behavior shifts.
カスタマーレビュー
5 | 100 % | |
4 | 0 % | |
3 | 0 % | |
2 | 0 % | |
1 | 0 % |