
説明
ユーザーは、主要な取引セッション(アジア、ロンドン、ニューヨーク、ロンドンクローズ)の開始時間と終了時間をカスタマイズ可能な色、スタイル、太さでマークできます。このインジケーターは各セッションの高値と安値のトレンドラインを描画し、市場の動向に関する洞察を提供します。使いやすいドラッグ&ドロップ(+Altキー)機能により、セッションの高値と安値のプロットが迅速に行えます。初心者から経験豊富なトレーダーまで、異なる市場セッションの複雑さをナビゲートしやすくするのに最適なインジケーターです。
特徴
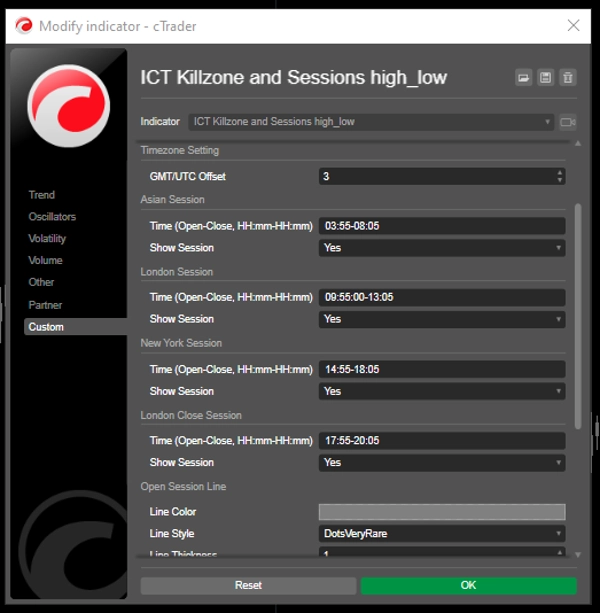
カスタマイズ可能なセッション時間:ユーザーは主要な取引セッション(アジア、ロンドン、ニューヨーク、ロンドンクローズ)の開始時間と終了時間を定義でき、取引戦略に合わせた視覚化が可能です。
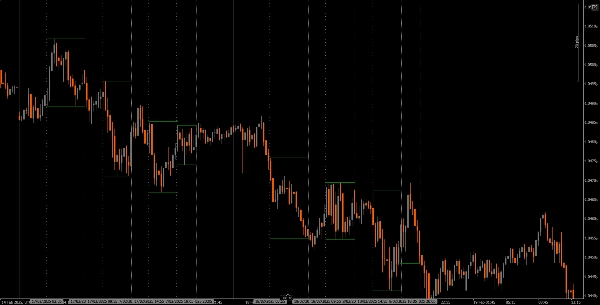
動的な垂直線:インジケーターはセッションの開始と終了時刻に垂直線を描画し、重要な市場イベントを一目で識別しやすくします。
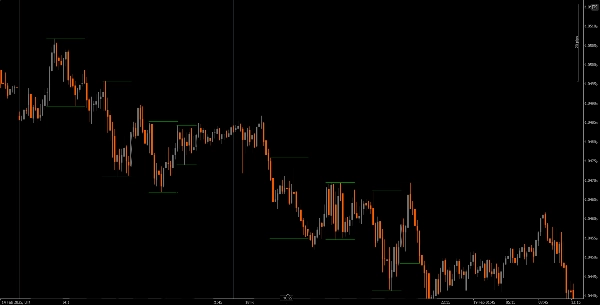
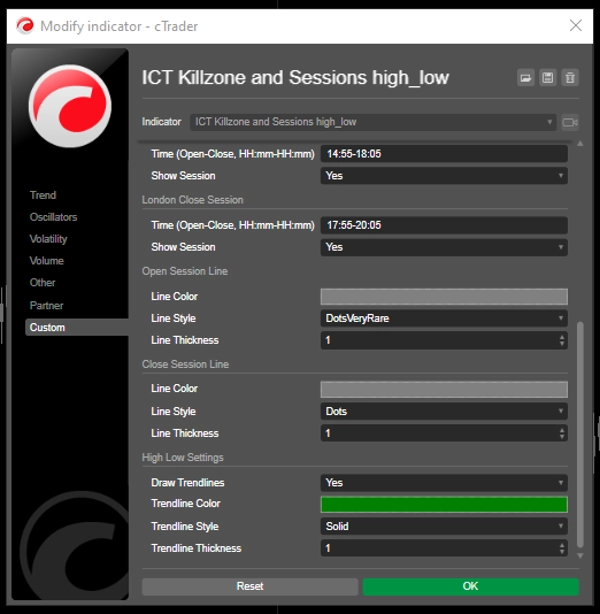
トレンドラインの可視化:各セッションの高値と安値のトレンドラインを自動的に描画し、トレーダーがセッションの価格動向に基づく潜在的なサポートおよびレジスタンスレベルを確認できます。
使いやすいドラッグ&ドロップ(+Altキー):ドラッグ&ドロップ(+Altキー)機能により、トレーダーは分析したい特定の時間範囲を簡単に選択でき、全体的なユーザー体験を向上させます。
セッションラベル:セッショントレンドラインの横にラベルを表示するオプションがあり、トレーダーがどのセッションを分析しているかを迅速に識別できます。
タイムゾーン調整:ユーザーはGMT/UTCのオフセットを設定でき、セッション時間が自分のローカルタイムゾーンに正確に表示されるようにします。
チュートリアル
インストール:cAlgoプラットフォームにThe ICT Killzone and Sessions high_lowインジケーターをダウンロードしてインストールします。
設定:設定を開き、セッション時間、色、ラインスタイル、太さを好みに合わせてカスタマイズします。
インジケーターの使用:チャート上でクリック&ドラッグ(+Altキー)して、分析したい時間範囲を囲む矩形を作成します。インジケーターは指定されたセッションの垂直線とトレンドラインを自動的に描画します。
分析:取引中にセッションラインとトレンドラインを観察します。この情報を使って、セッションの動態に基づく潜在的なサポートおよびレジスタンスレベルを特定します。
推奨コンパニオンツール
cTrader:cAlgoのネイティブプラットフォームで、インジケーターの使用とカスタマイズをシームレスに行えます。
市場分析ツール:移動平均線やオシレーターなどの市場分析ツールとこのインジケーターを組み合わせて、取引戦略を強化します。
リスク管理ツール:ポジションサイズ計算機やストップロスツールを使用して、取引中のリスクを効果的に管理します。
The ICT Killzone and Sessions high_lowインジケーターをこれらのツールと統合することで、トレーダーは市場分析を改善し、異なる取引セッションの複雑さを乗り越える成功の可能性を高めることができます。
概要
A drag-and-drop (+Alt Key) feature allows quick selection of specific time ranges for analysis. Optional session labels clarify which session is being viewed. Timezone adjustments via GMT/UTC offset ensure session times align with the trader’s local time zone.
Designed for use on the cAlgo platform, this tool supports enhanced market analysis when combined with other market analysis and risk management tools. It assists traders in navigating the complexities of different market sessions by providing clear visual cues and trendline insights.
カスタマーレビュー
5 | 40 % | |
4 | 20 % | |
3 | 0 % | |
2 | 0 % | |
1 | 40 % |


