
Descrição
Indicador de Padrão Martelo – Explicação da Estratégia
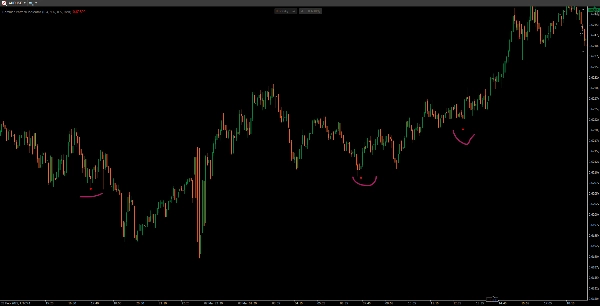
Este Indicador de Padrão Martelo é um sinal de reversão baseado em candlestick que identifica padrões de martelo de alta em uma tendência de baixa. Ele foi projetado para detectar potenciais reversões de tendência e destacar oportunidades de compra.
Como Funciona
1️⃣ Detecta Tendência de Baixa
- O preço de fechamento da vela deve ser inferior ao fechamento de 3 barras atrás, indicando uma possível tendência de baixa.
2️⃣ Valida a Estrutura do Candlestick Martelo
- Corpo Pequeno: O corpo da vela é relativamente pequeno (≤ 30% do alcance total).
- Sombra Inferior Longa: O pavio inferior é pelo menos 2 vezes o tamanho do corpo (mostra forte rejeição a preços mais baixos).
- Sombra Superior Curta: O pavio superior é ≤ 30% do tamanho do corpo (indicando pouca resistência no topo).
3️⃣ Plota um Sinal de Compra
- Se todas as condições forem atendidas, um ponto vermelho (ou uma cor escolhida) aparece logo abaixo da mínima da vela martelo como uma confirmação visual de uma possível reversão.
Principais Características
✅ Filtra sinais fracos garantindo uma tendência de baixa anterior.
✅ Parâmetros personalizáveis para tamanho do corpo, comprimento das sombras e cores.
✅ Padrão de candlestick simples, porém eficaz para traders de swing e traders de price action.
📌 Melhor Uso: Confirme o padrão martelo com indicadores adicionais (ex.: volume, níveis de suporte) para sinais mais fortes! 🚀
Resumo
Avaliações de clientes
5 | 100 % | |
4 | 0 % | |
3 | 0 % | |
2 | 0 % | |
1 | 0 % |


