
KeyLevels
Indicator
328 downloads
Version 1.0, Nov 2025
Windows, Mac
Description
Overview
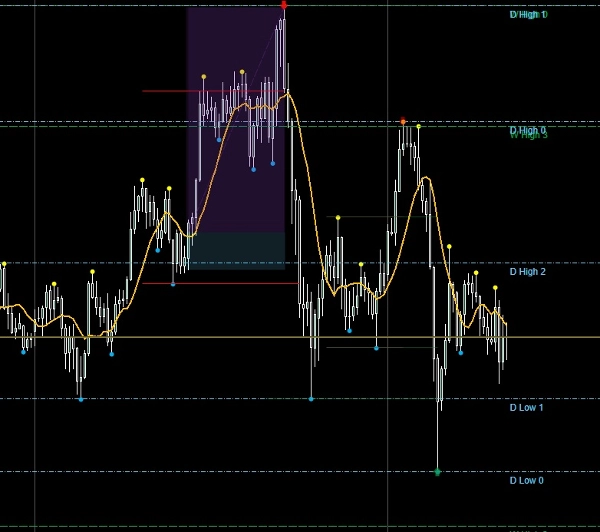
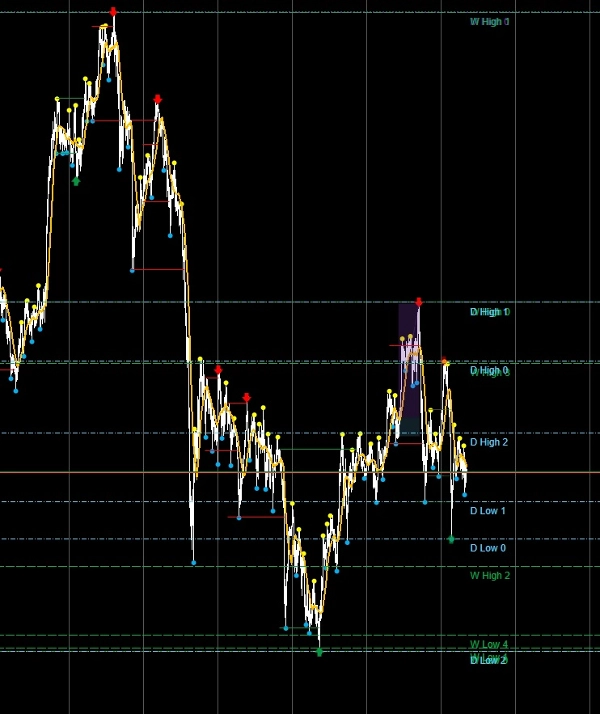
The Key Levels Indicator is built for traders who rely on higher‑timeframe anchors to guide intraday execution. It automatically identifies and draws horizontal lines for monthly, weekly, and daily highs and lows, giving you instant structural awareness across multiple timeframes. Each level is fully customizable, so you can tailor the visuals to match your playbook and workflow.
Key Features
- 🔹 Multi‑Timeframe Levels – Plots highs and lows from monthly, weekly, and daily bars.
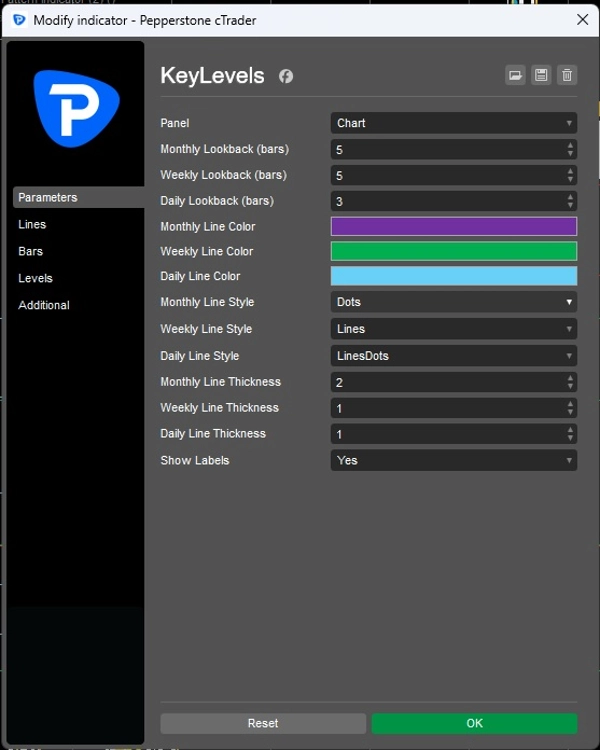
- 🔹 Custom Lookback Periods – Choose how many past bars to include for each timeframe.
- 🔹 Visual Customization – Set individual colors, line styles, and thickness for monthly, weekly, and daily levels.
- 🔹 Labels Option – Toggle labels on/off for clear identification of each level.
- 🔹 Dynamic Updates – Levels refresh automatically as new bars close.
- 🔹 Clean Chart Integration – Lines are drawn directly on your chart for easy reference.
Benefits for Traders
- Anchors your intraday setups to objective higher‑timeframe levels.
- Reinforces discipline and conviction filters by showing only key structural points.
- Saves time by automating level plotting — no more manual drawing.
- Enhances clarity when combining multiple timeframe analysis.
Use Cases
- Intraday scalpers can align entries with daily or weekly levels.
- Swing traders can track monthly anchors for continuation setups.
- Playbook‑driven traders can integrate the indicator into their unified checklist for instant classification.
Summary
Indicator profile
Customer reviews
0.0
Reviews: 0
Customer reviews
No reviews for this product yet. Already tried it? Be the first to tell others!
Discussion
FAQ
BTCUSD
Forex
Signal
Breakout
Indices
EURUSD
Commodities
GBPUSD
NZDUSD
Prop
Scalping
Crypto
Stocks
XAUUSD
NAS100
USDJPY
Products available through cTrader Store, including trading bots, indicators and plugins, are provided by third-party developers and made available for informational and technical access purposes only. cTrader Store is not a broker and does not provide investment advice, personal recommendations or any guarantee of future performance.
More from this author


!["[Stellar Strategies] MARSI Signal Plotter" logo](https://cdn.ctrader.com/image/webp/7b2b8da6-8f8e-4646-8d4a-4710c516c01e_25567)


Price
Since 24/04/2025
160.64M
Traded volume
17.55K
Pips won
11
Sales
328
Free installs