Description
📈 Divergency v1.1 Indicator for cTrader: A Comprehensive Guide 🚀
The Divergency v1.1 indicator is a powerful tool designed for the cTrader platform to identify divergences and correlations between price action and various oscillators. This guide provides a detailed description of the code, its functionality, and step-by-step instructions on how to use it effectively. Whether you're a beginner or an experienced trader, this indicator can enhance your technical analysis with customizable settings and visual cues. Let’s dive in! 🌟
🎯 Overview of the Divergency11 Indicator
The Divergency v1.1 indicator analyzes price movements and oscillator behavior to detect:
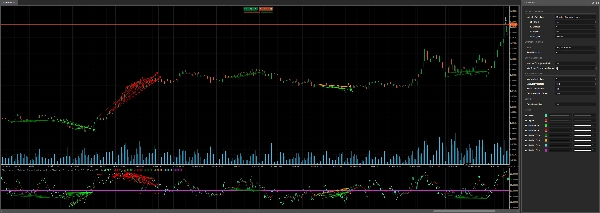
- Regular Divergences: Signals potential reversals when price and indicator move in opposite directions.
- Hidden Divergences: Indicates trend continuation when price and indicator align differently.
- Correlations: Highlights when price and indicator move in sync, suggesting trend strength.
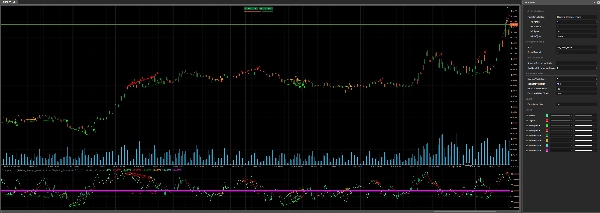
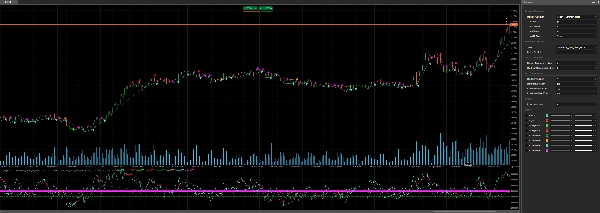
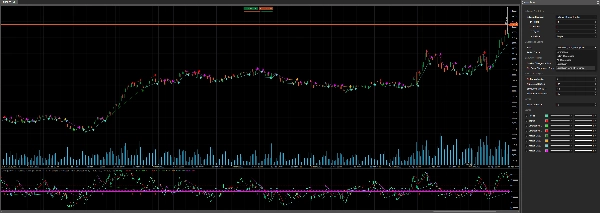
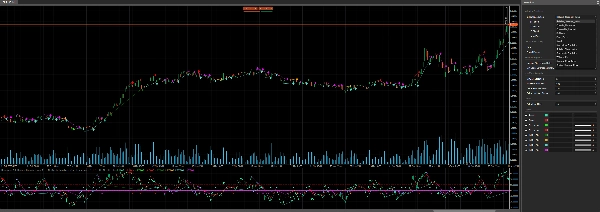
It supports 12 different oscillators (e.g., RSI, MACD, Stochastic) and allows customization of divergence detection parameters, making it versatile for various trading strategies. The indicator plots signals directly on the chart and indicator area, using colored lines, icons, and text for clear visualization. 📊
🔍 Code Breakdown
1. Indicator Setup 🛠️
- Namespace and Class: Defined in the
cAlgonamespace asDivergency v1.1, inheriting fromIndicator. - Attributes:
IsOverlay = false: Displays in a separate indicator window.TimeZone = TimeZones.UTC: Uses UTC for consistency.AccessRights = AccessRights.None: No special permissions required.
2. Parameters ⚙️
The indicator offers extensive customization through parameters, grouped for clarity:
- Oscillator Selection:
IndicatorSelection: Choose from 12 oscillators (e.g., RSI, MACD, Stochastic).(Normalised to 50 as middle, and result higher for optimisation process)Value1,Value2,Value3: Adjust period, smoothing, and signal line settings.MaType: Select moving average type (e.g., Simple, Exponential).
- Divergence Settings:
Strat: Choose detection mode (Divergence, Hidden Divergence, Correlation, or combinations).PeriodFractal: Set fractal period for identifying peaks/troughs (must be odd).LookBack: Number of historical divergences to analyze.MinCountDivergenceShow: Minimum divergences required to display signals.
- Zone Analysis:
MinBarsValidation,MaxBarsValidation: Define valid bar range for divergence detection.ExtraLevelMin,ExtraLevelMax: Set oscillator overbought/oversold thresholds.
- Levels:
ExtraLevelLine: Adjusts oversold/overbought lines around the 50 level.
3. Outputs 📈
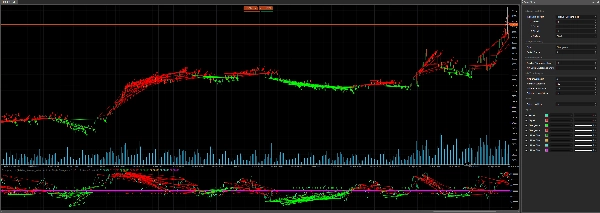
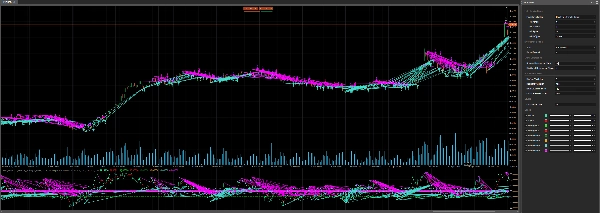
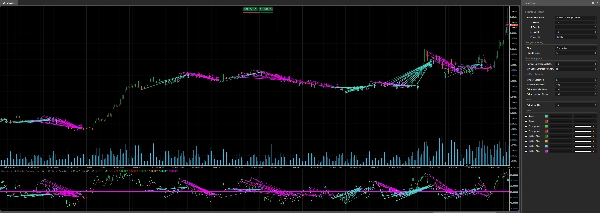
Result: Main oscillator value (green line).Signal: Smoothed signal line (red line).- Divergence signals (plotted as points):
ResDivergenceUp(Lime),ResDivergenceDown(Red): Regular divergences.ResDivergenceUpHidden(Green),ResDivergenceDownHidden(Orange): Hidden divergences.ResCorrelationUp(Turquoise),ResCorrelationDown(Magenta): Correlations.
4. Key Functions 🧠
- Initialize(): Sets up the indicator, validates parameters, and draws static lines (oversold, overbought, zero).
- Calculate(): Computes oscillator values, normalizes them around 50, and detects fractals for divergence analysis.
- GetFractal(): Identifies peaks (fractalUp) and troughs (fractalDown) in the oscillator.
- GetDivergence(): Analyzes fractal points to detect divergences or correlations.
- CreateLine(): Draws trend lines and icons for detected signals.
- DawDivergence(): Visualizes divergences with lines and arrows on the chart and indicator area.
5. Helper Classes 📋
SRPrice: Stores fractal data (index, price, indicator value).DivergenceFind: Tracks divergence details (title, time, prices, color).
6. Error Handling 🚨
The indicator checks for invalid parameters (e.g., MinBarsValidation > MaxBarsValidation, even PeriodFractal) and displays warnings in the indicator area using DrawStaticText.
🛠️ How to Use the Divergency11 Indicator
Step 1: Installation 📥
- Download the Code: Copy the provided C# code.
- Add to cTrader:
- Open cTrader and navigate to cAlgo > Indicators.
- Click New and paste the code into the editor.
- Build the indicator (ensure no compilation errors).
- Apply to Chart:
- Open a chart in cTrader.
- Add the Divergency11 indicator from the indicators list.
Step 2: Configure Parameters ⚙️
Customize the settings to match your trading style:
- Choose an Oscillator:
- Select an oscillator (e.g.,
Relative_Strenght_Indexfor RSI) viaIndicatorSelection. - Adjust
Value1(period),Value2(smoothing), andValue3(signal period) as needed.
- Select an oscillator (e.g.,
- Set Divergence Type:
- Use
Stratto focus onDivergence,Hiden_Divergence,Correlation, orAll_Divergence.
- Use
- Fractal and Lookback:
- Set
PeriodFractalto an odd number (e.g., 5) for symmetry. - Adjust
LookBackto control how many historical divergences are analyzed.
- Set
- Zone and Levels:
- Configure
ExtraLevelMinandExtraLevelMaxfor overbought/oversold zones. - Set
ExtraLevelLineto adjust visual thresholds.
- Configure
Step 3: Interpret Signals 📊
- Regular Divergence:
- Up (Lime): Bearish signal (price makes higher highs, oscillator makes lower highs).
- Down (Red): Bullish signal (price makes lower lows, oscillator makes higher lows).
- Hidden Divergence:
- Up (Green): Bullish continuation (price makes lower highs, oscillator makes higher highs).
- Down (Orange): Bearish continuation (price makes higher lows, oscillator makes lower lows).
- Correlation:
- Up (Turquoise): Strong bullish trend (price and oscillator both rising).
- Down (Magenta): Strong bearish trend (price and oscillator both falling).
- Visual Cues:
- Trend lines connect divergence points on the chart and indicator.
- Arrows indicate signal direction (up/down).
- Text displays the number of detected divergences (if
LookBack > 1).
Step 4: Trading Strategies 💡
- Reversal Trading:
- Use regular divergences (Lime/Red) to spot potential reversals.
- Confirm with other indicators (e.g., support/resistance, candlestick patterns).
- Trend Continuation:
- Hidden divergences (Green/Orange) signal trend continuation.
- Enter trades in the direction of the trend after a pullback.
- Trend Strength:
- Correlations (Turquoise/Magenta) confirm strong trends.
- Use as a filter to avoid counter-trend trades.
- Timeframe:
- Works on any timeframe, but higher timeframes (H1, H4) reduce noise.
- Risk Management:
- Set stop-losses below recent swing lows (for longs) or above swing highs (for shorts).
- Use the ATR (included in the code) to size positions.
Step 5: Optimization 🔧
- Backtest: Use cTrader’s backtesting feature to test the indicator on historical data.
- Adjust Parameters: Experiment with
PeriodFractal,LookBack, andMinCountDivergenceShowto reduce false signals. - Combine Indicators: Pair with trend indicators (e.g., Moving Averages) or volatility tools (e.g., Bollinger Bands).
🌟 Tips for Success
- Start Simple: Begin with default settings and a familiar oscillator like RSI.
- Practice on Demo: Test the indicator on a demo account to understand its signals.
- Monitor Alerts: Watch for arrows and trend lines to act on signals promptly.
- Avoid Overtrading: Use divergences as part of a broader strategy, not in isolation.
- Stay Updated: Check for code updates or community feedback on cTrader forums.
⚠️ Common Issues and Solutions
- No Signals Appear:
- Check
MinCountDivergenceShowvs.LookBack(former must be ≤ latter). - Ensure
PeriodFractalis odd.
- Check
- Too Many Signals:
- Increase
MinCountDivergenceShowor reduceLookBack. - Tighten
MinBarsValidationandMaxBarsValidation.
- Increase
- Error Messages:
- Review parameter warnings in the indicator area (e.g.,
MinBarsValidation > MaxBarsValidation). - Correct invalid settings and reapply the indicator.
- Review parameter warnings in the indicator area (e.g.,
🎉 Conclusion
The Divergency v1.1 indicator is a versatile and robust tool for cTrader users, offering deep insights into price-oscillator relationships. With its customizable settings and clear visual outputs, it empowers traders to spot reversals, continuations, and trend strength with confidence. Try it out, tweak the parameters, and integrate it into your trading plan to elevate your analysis! 🚀
Happy trading, and may your charts be ever green! 📈💚
Summary
- Regular divergences signaling potential reversals when price and oscillator move oppositely.
- Hidden divergences indicating trend continuation with differing price and oscillator alignments.
- Correlations highlighting synchronized movements suggesting trend strength.
Signals are displayed on the chart and indicator window using colored lines, icons, and text for clarity. Visual cues include trend lines connecting divergence points and arrows indicating signal direction. Key functions handle initialization, calculation of normalized oscillator values, fractal detection, divergence analysis, and drawing of signals.
Users can configure overbought/oversold zones and adjust lookback periods to tailor signal sensitivity. The indicator works on any timeframe, with higher timeframes recommended to reduce noise. It includes error handling for invalid parameters and provides guidance for installation, parameter setup, signal interpretation, and trading strategies such as reversal and trend continuation. Backtesting and parameter optimization are supported within cTrader to refine performance.
Customer reviews
5 | 100 % | |
4 | 0 % | |
3 | 0 % | |
2 | 0 % | |
1 | 0 % |