
Description
What PrometheusSMC Analyses
PrometheusSMC reads price structure, volume, and volatility across multiple timeframes to identify where institutional activity is most likely to influence price. It processes six data layers on every bar:
- Market structure — swing highs/lows (delayed by StructureStrength bars for confirmation), BOS (trend continuation), and CHoCH (reversal)
- Order blocks — zones where institutional orders likely accumulated, filtered by volume exceeding OB Volume Threshold standard deviations above the mean
- Fair Value Gaps — 3-candle price imbalances with fill tracking; zones are removed once price trades through the gap body (not just the edge)
- Liquidity sweeps — detects when price wicks beyond a prior swing point before reversing, the classic stop-hunt pattern
- Trend regime — EMA crossover combined with ADX volatility filter and Bollinger Band width to classify the market as trending, ranging, or choppy
- Session context — identifies dead-zone hours (07:00 and 11:00 UTC) where signals are dimmed to reduce noise
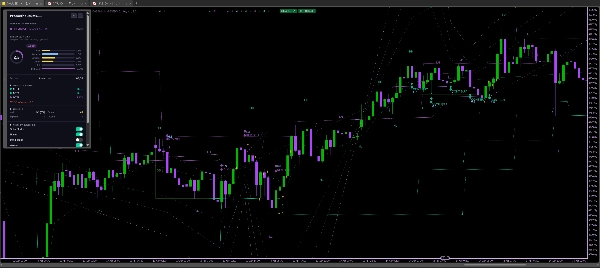
How to Interpret Signals and Visual Elements
Arrows and labels:
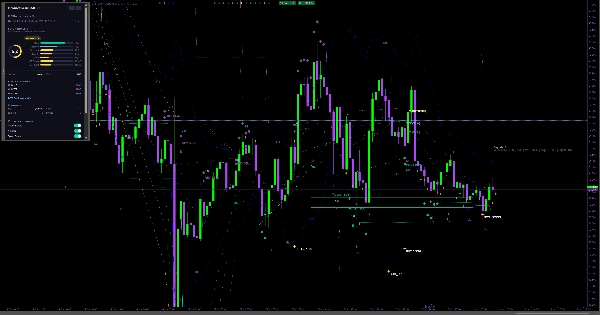
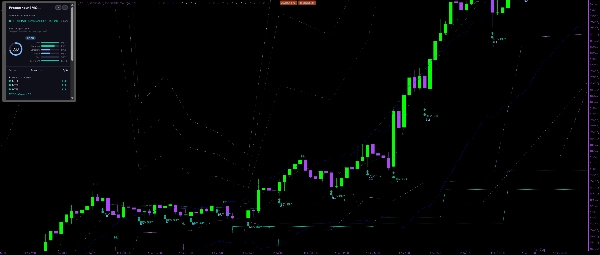
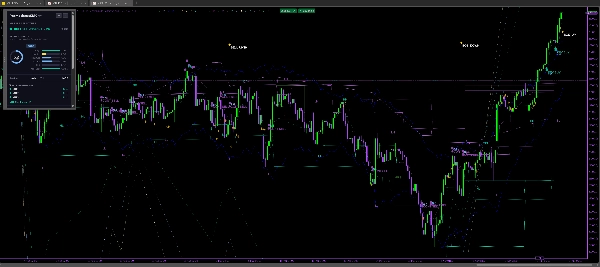
- REV BUY / REV SELL arrows mark CHoCH (Change of Character) — the first sign a trend may be reversing
- CONT BUY / CONT SELL arrows mark BOS (Break of Structure) — trend continuation
- Arrow color reflects the setup quality tier: cyan = HIGH, green = GOOD, purple = MODERATE, sky blue = MODERATE, yellow = WEAK, gray = POOR
Colored zones:
- Green/purple rectangles mark bullish/bearish order blocks; zones fade once mitigated
- Teal/purple dotted lines mark unfilled Fair Value Gaps; they disappear once price trades through the gap
- Purple/cyan anchor lines extend from CHoCH points showing the origin of the reversal
TP/SL levels:
- TP1 and TP2 use fixed multipliers from entry (default 1.5× and 2.5× risk)
- TP3 targets the opposing liquidity pool (nearest swing point or order block above/below entry) — the structure target for the big move
- SL is placed at the order block extreme with a configurable multiplier buffer
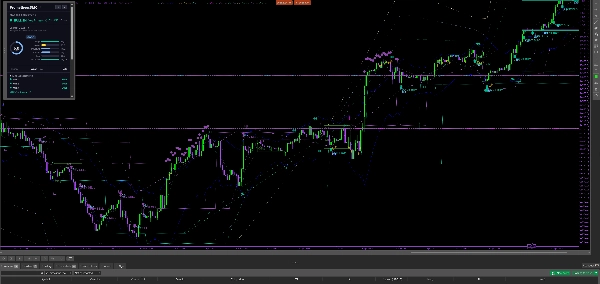
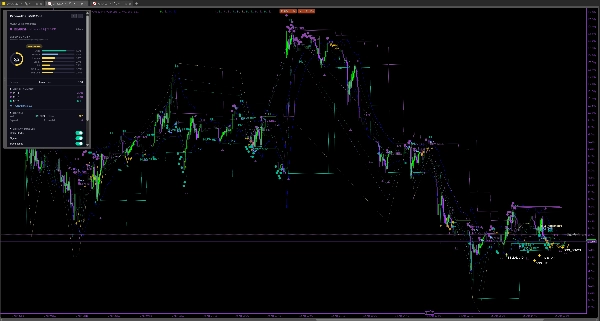
Dashboard shows current trend, active setup score, MTF alignment across three timeframes, session status, sweep and FVG presence, and calculated position size based on your account risk %.
Key Settings and Parameters
Structure Strength (default: 4) — Bars to confirm a swing point. Higher = fewer but more significant structure breaks.
Lookback Period (default: 12) — Bars for volume average and OB scanning.
OB Volume Threshold (default: 1.8σ) — How much volume must exceed the mean to validate an order block.
Minimum Score for Signal (default: 6, range: 0-10) — Quality gate. Signals only fire when the composite score meets this threshold.
Sweep Bonus Weight (default: 1.0) — How much a liquidity sweep before CHoCH boosts the setup score.
FVG Bonus Weight (default: 0.5) — How much proximity to an unfilled FVG boosts the setup score.
Sweep Lookback Bars (default: 0 / auto) — How far back to look for swing points when checking sweeps. Auto = Structure Strength × 4. Increase to 100-200 on lower timeframes to catch daily-level sweeps.
Enable Structure-Based TP (default: on) — When enabled, TP3 targets the opposing swing point or order block instead of a fixed multiplier.
MTF1 / MTF2 / MTF3 Timeframes (default: 60 / 240 / 1440 min) — Three higher timeframes for alignment scoring.
Risk Per Trade % (default: 1.0%) — Used for position size calculation on the dashboard.
Show Dashboard (default: on) — On-chart HUD with score, trend, and MTF alignment.
Use WebView Dashboard (default: off) — Expanded HTML dashboard with more detail. Requires Windows or macOS cTrader Desktop.
Typical Use Cases
Scalping on 1-5m with structure context: Set Structure Strength to 2-3 for faster signals, lower Minimum Score for Signal to 5, and use the 60m MTF for bias. The conviction heatmap lets you skip low-quality entries at a glance.
Intraday on 15m: Default settings work well. Watch for CHoCH arrows with sweep bonus (cyan/green) during London or New York sessions. Take TP1 quickly, let TP3 run to the opposing liquidity pool.
Swing on 1H/4H: Increase Structure Strength to 5-6 for significant structure breaks. Set Sweep Lookback Bars to 200+ to catch sweeps of weekly highs/lows. Raise Minimum Score for Signal to 7-8 for fewer but higher-quality entries.
Confluence filter: Enable MTF alignment and require at least 2 of 3 timeframes agreeing with the signal direction before entering.
Who This Indicator Is Best Suited For
PrometheusSMC is built for traders who already understand Smart Money Concepts (order blocks, Fair Value Gaps, liquidity sweeps, market structure) and want a consistent, rule-based system for identifying and scoring setups. It is not a plug-and-play
signal service — the quality scoring requires you to understand what the components mean and tune them to your instrument and timeframe.
Experience level: Intermediate to advanced. Beginners can use it to learn SMC by watching how structure, OBs, and FVGs interact, but should paper-trade first and study the scoring breakdown before risking capital.
Trading style: Intraday and swing traders on forex, indices (US30, NAS100), and gold (XAUUSD). Scalpers can use it with reduced structure strength. It includes presets for XAUUSD, US30, NAS100, and major forex pairs.
Important Limitations and Usage Notes
- Non-repainting: Output series (arrows, labels, zones) only appear on confirmed bars. The live bar updates internal scoring responsively, but structural state (swing points, trend direction, order blocks, FVGs) only commits on bar close. This means
the last bar on your chart may shift as price moves — this is expected and correct behavior
- No guaranteed profitability: PrometheusSMC identifies structure and scores confluence; it does not predict direction. Any setup can fail. Always use proper risk management and never risk more than you can afford to lose
- WebView Dashboard requires cTrader Desktop on Windows or macOS. It will not render on cTrader Web or Mobile. The on-chart dashboard works on all platforms
- Preset instruments (XAUUSD, US30, etc.) adjust structure strength, EMA periods, and OB thresholds for each market. If your instrument is not in the preset list, start with defaults and tune from there
- Historical performance shown by any backtest or chart replay does not guarantee future results. Past signals visible on the chart may look better than they were in real time due to the nature of confirmed-bar-only output

















