
Description
MOMENTUM TIDEBREAKER
A trend and momentum indicator that raises signals from three independent families, draws the trade levels for each one, and follows them to their outcome on a 16-row dashboard.
WHAT IT PUTS ON YOUR CHART
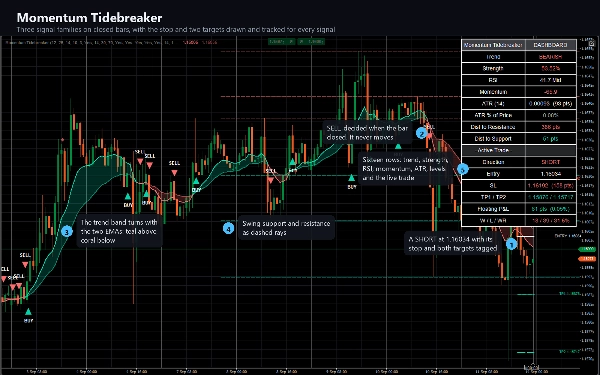
- A fast and a slow EMA, coloured by trend, with a translucent band between them that turns bullish or bearish with the trend.
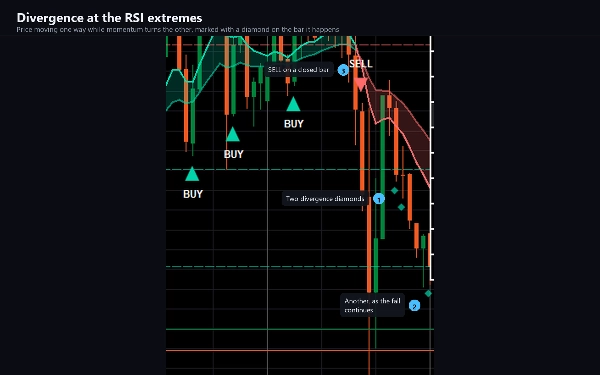
- BUY and SELL markers, larger STRONG markers where a signal coincides with a momentum divergence, and a small diamond on every divergence bar.
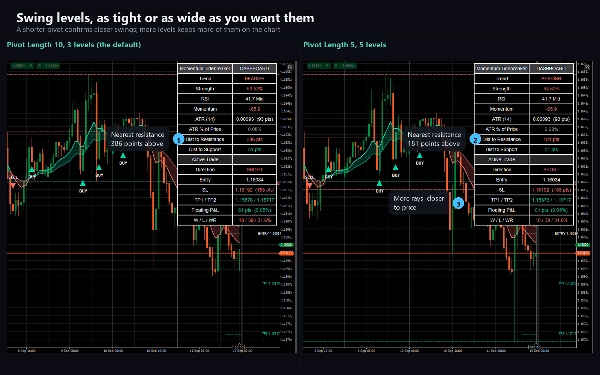
- Swing support and resistance levels drawn as dashed rays, up to five per side.
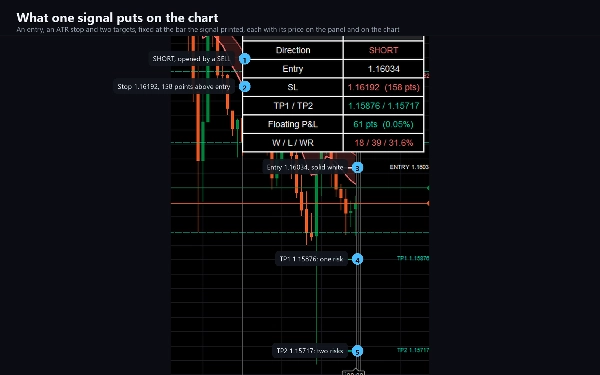
- For every signal: an entry line, a stop and two targets, each labelled with its price.
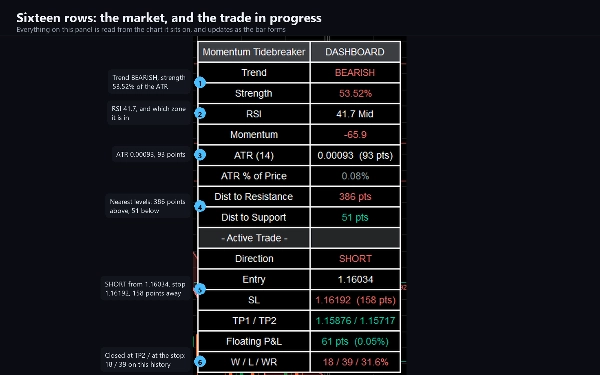
- A dashboard in the corner: trend, trend strength, RSI and its zone, momentum, ATR in price, ticks and percent, the distance to the nearest resistance and support, and the active trade with its entry, stop, targets, floating result and a win/loss count.
THREE SIGNAL FAMILIES, ALL ON CLOSED BARS
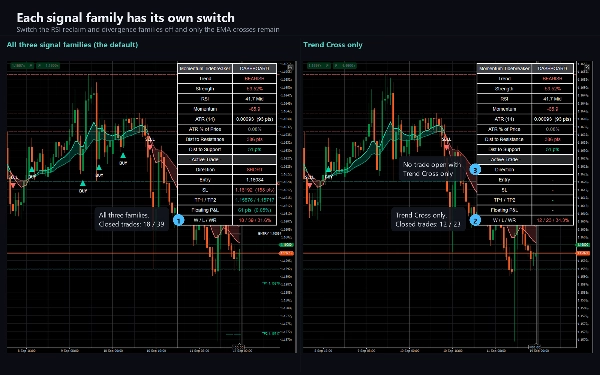
- Trend Cross - the fast EMA crosses the slow EMA, confirmed by RSI on the right side of 50, a trend strength above 1 % of volatility and, optionally, 5-bar momentum pointing the same way.
- RSI Reclaim - RSI crosses 50 in the direction of the EMA trend while price holds the right side of the slow EMA.
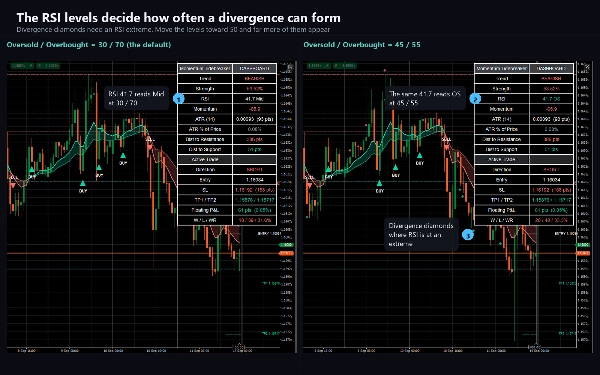
- Divergence - price keeps falling while momentum turns up at an oversold RSI (the mirror at overbought), with the close back across the fast EMA.
Each family has its own switch. Every signal is decided when its bar closes and never moves afterwards.
STOP AND TARGETS
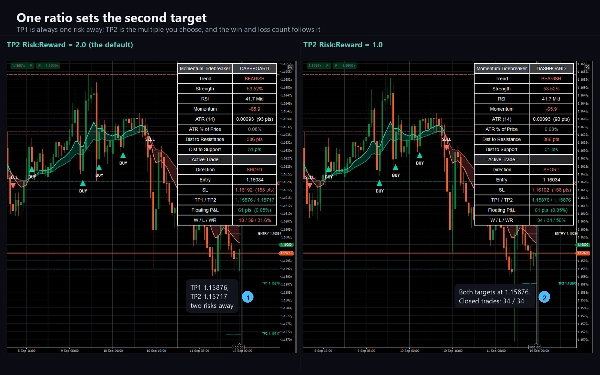
The stop sits a chosen number of ATRs from the signal bar's close. TP1 is one risk away and TP2 is the risk-to-reward multiple you set. On each following bar the levels are checked in a fixed order - TP2, then TP1, then the stop - and the dashboard shows which has been reached, with TP1 marked once it is booked.
ALERTS
Nine events, each with its own switch: BUY, SELL, STRONG BUY, STRONG SELL, TP1, TP2, stop, bullish divergence and bearish divergence. Each goes to the cTrader log, a sound or an e-mail, once per closed bar.
KEY SETTINGS
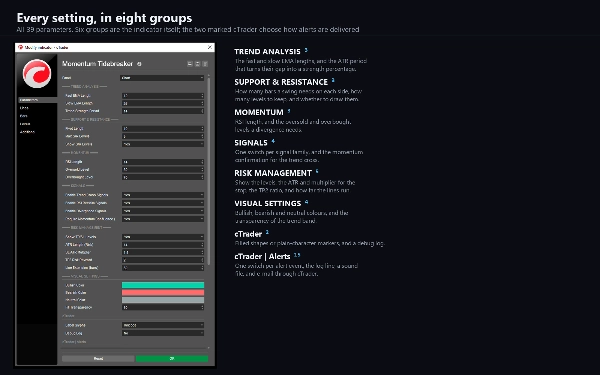
Fast and slow EMA lengths, trend strength period, pivot length and the number of levels, RSI length with oversold and overbought levels, the three family switches and the momentum confirmation, the ATR length and multiplier for the stop, the TP2 risk-to-reward, how far the trade lines run, and the bullish, bearish and neutral colours with the band's transparency. Thirty-nine parameters, every one documented.
INDICATOR TYPE AND WINDOW
An overlay indicator: it draws on the price chart, not in a separate pane. It reads the chart's own bars only.
PREFERRED TIMEFRAMES AND INSTRUMENTS
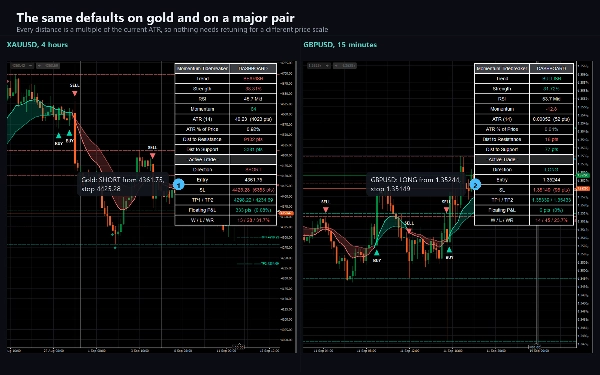
M15 to H1 is a balanced starting point. H4 and D1 give fewer, slower signals and levels that hold for days; M1 and M5 give many more signals. Built and verified on EURUSD and XAUUSD, and symbol-agnostic, so it works on forex pairs, metals, indices and crypto alike.
WHO IT IS FOR
Traders who combine trend direction with momentum confirmation and want the entry, stop and targets drawn and followed rather than measured by hand, intraday or swing.
WHAT IT IS NOT
It is not an automated system. It places no orders, opens no network connection and reads no file - it declares no access rights at all, which you can check in the algorithm's details.
THE TRIAL
The trial is the same product restricted to EURUSD, with any broker suffix accepted. There is no time limit and nothing is withheld. The full version adds every other symbol.
TECHNICAL NOTES
cTrader Desktop 5.x. Signals and trade lines do not repaint; the dashboard and the support and resistance levels update while a bar forms. A swing level is confirmed Pivot Length bars after the swing. cTrader shows a right-hand margin only with Chart Shift enabled, so price tags beyond the last bar sit just inside the right edge.
SUPPORT
Through the Discussion tab on this page. Please include your broker, symbol, timeframe, cTrader version and a screenshot of the whole chart including the dashboard.
Trading involves risk. Past performance does not guarantee future results.
Summary
Key chart features include buy/sell markers, strong signal markers when momentum divergence coincides, swing support and resistance levels (up to five per side), and detailed trade levels for each signal: entry, stop loss (based on ATR multiples), and two profit targets with price labels. A 16-row dashboard provides real-time information on trend direction and strength, RSI status, momentum, ATR values, proximity to support/resistance, and active trade performance including floating results and win/loss counts.
Signals are generated based on EMA crosses confirmed by RSI and trend strength, RSI crossing 50 aligned with EMA trend, and price-momentum divergences at overbought/oversold RSI levels. Alerts can be configured for nine event types including signals, targets, stops, and divergences.
The indicator is symbol-agnostic, verified on EURUSD and XAUUSD, and suitable for multiple timeframes from M15 to daily. It is intended for traders combining trend and momentum analysis who prefer automated visualization of entries, stops, and targets without automated order execution.
Discussion
Customer reviews
5 | 33 % | |
4 | 67 % | |
3 | 0 % | |
2 | 0 % | |
1 | 0 % |