Açıklama
İki Basit Hareketli Ortalama (SMA) arasındaki kesişimleri algılayan ve her şeyi grafik üzerinde net bir şekilde gösteren temiz, basit ve oldukça görsel bir gösterge.
Ana Özellikler:
- Tam kesişim noktasında büyük renkli oklar → Açık Yeşil ↑ → Boğa kesişimi (potansiyel alım) → Kırmızı ↓ → Ayı kesişimi (potansiyel satış)
- Grafiğin sağ üst köşesinde kalıcı durum paneli → En son kesişim türü (BOĞA / AYI / BEKLEME) → Kesişim tarihi ve saati → Hareketli ortalamaların ayarlanmış dönemleri
- %100 yeniden boyamayan
- Aynı bar üzerinde tekrar eden sinyalleri engeller
- Her kesişimde loga mesaj yazar (takip için harika)
- Çok hafif – her zaman diliminde mükemmel çalışır
Benim favori kullanım şeklim (ve önerdiğim):
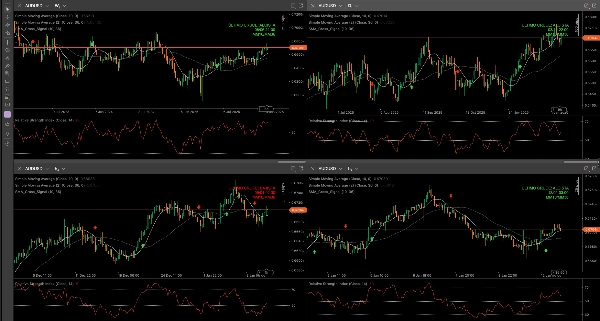
Aynı anda Haftalık, Günlük, H4 ve H1 zaman dilimlerinde aynı döviz çiftine uygularım.
Genellikle girişleri H1 zaman diliminde yaparım, ancak göstergenin daha yüksek zaman dilimlerinde olması bana çiftin baskın yönü hakkında çok güçlü bir genel bakış sağlar:
- Haftalık ve Günlük zaman dilimlerinde boğa/ayı kesişimleri uyumlu mu? → Daha yüksek olasılık
- Zaman dilimleri arasında çelişkili sinyaller mi var? → Beklemek veya pozisyon büyüklüğünü azaltmak daha iyi
İyi çalışan popüler konfigürasyonlar:
- 9 / 21
- 10 / 30
- 21 / 50
- 50 / 200 (özellikle Haftalık ve Günlük grafiklerde faydalı)
Hem yeni başlayanlar için (net görselleri ve sadeliği sayesinde) hem de Fiyat Hareketi, destek/direnç veya hacim ile birleştirmek isteyen deneyimli traderlar için mükemmel bir temel.
Tüm cTrader topluluğu için tamamen ücretsiz!
Demo üzerinde deneyin, çoklu zaman dilimi modunda uygulayın ve beğenirseniz… favori ayarlarınızı veya en iyi çalıştığı çifti yorum olarak bırakmaktan çekinmeyin 😊
Herkese iyi işlemler!
Özet
Key features include non-repainting signals, prevention of duplicate alerts on the same bar, and log messages for each crossover event. The indicator is lightweight and compatible with any timeframe, making it suitable for multi-timeframe analysis. Commonly used SMA period pairs include 9/21, 10/30, 21/50, and 50/200, with the latter especially useful on weekly and daily charts.
Traders often apply the indicator simultaneously on weekly, daily, 4-hour, and 1-hour timeframes to gain a comprehensive view of market direction and improve entry timing. It supports various markets including Forex and popular symbols like EURUSD, GBPUSD, USDJPY, XAUUSD, and BTCUSD. The indicator is designed for both beginners and experienced traders seeking clear, straightforward moving average crossover signals.