Descrizione
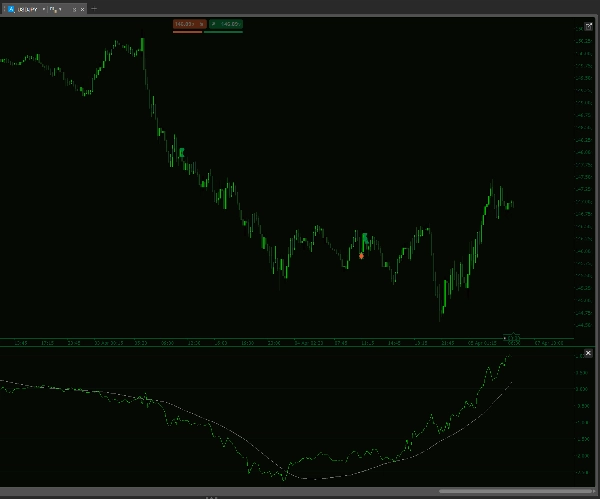
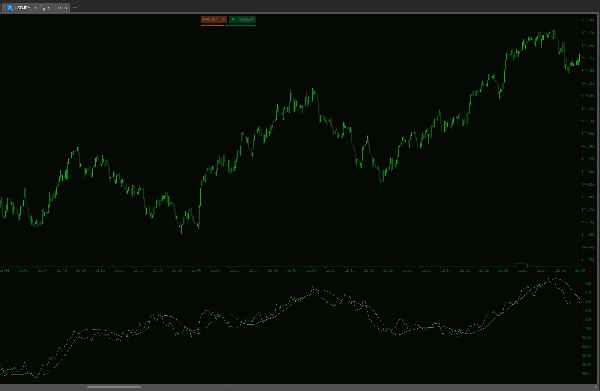
Eleva la tua strategia di trading con il Indicatore Storico DXY HMA—uno strumento all'avanguardia per cTrader progettato per precisione e prestazioni. Questo indicatore avanzato calcola un Indice del Dollaro USA personalizzato combinando le variazioni percentuali ponderate di sei coppie di valute chiave, fornendoti un indicatore di mercato dinamico e affidabile.
Caratteristiche principali:
- Calcolo DXY Personalizzato: Integra sei principali coppie USD (EURUSD, USDJPY, GBPUSD, USDCAD, USDCHF, USDSEK) con pesi configurabili per un indice finemente calibrato.
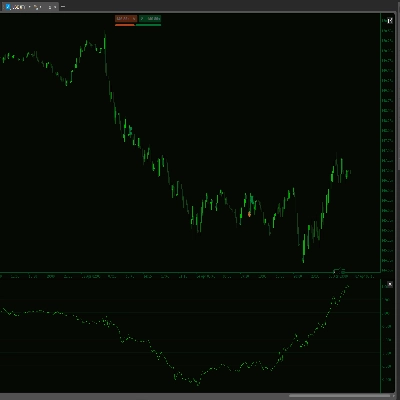
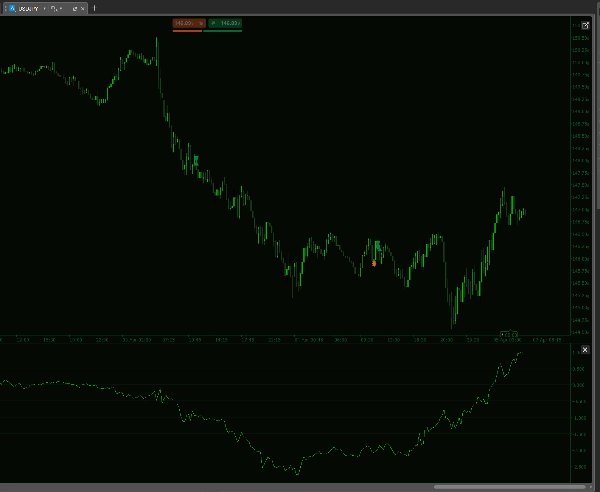
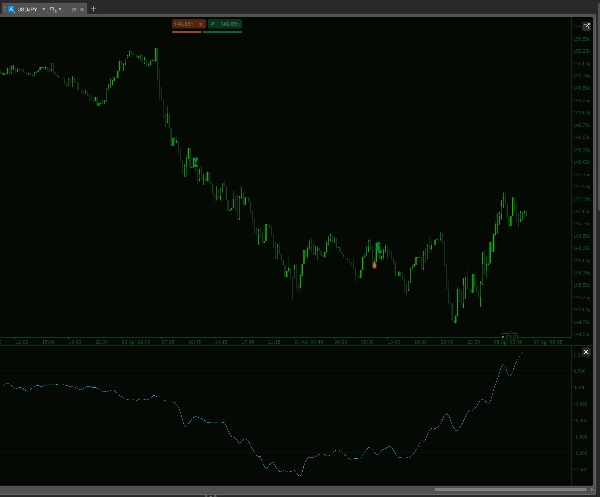
- Doppia Media Mobile Hull: Utilizza sia medie mobili Hull a breve che a lungo periodo per offrire un quadro chiaro delle tendenze e del momentum di mercato.
- Smussamento della Pendenza: Migliora il rilevamento delle tendenze con una pendenza HMA smussata, dandoti un vantaggio nell'identificare inversioni di mercato.
- Gestione Robusta dei Dati: Si sincronizza perfettamente con la tua piattaforma cTrader, garantendo un'analisi accurata in tempo reale anche con fonti di dati variabili.
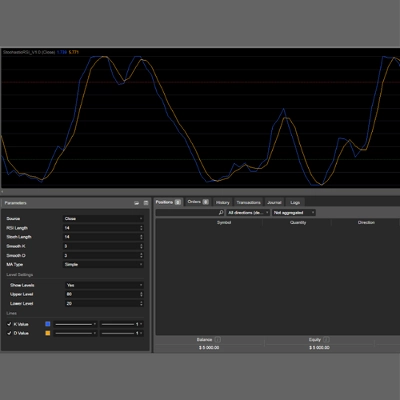
- Parametri Personalizzabili: Regola con precisione i conteggi di lookback e i periodi delle medie mobili per adattarsi perfettamente al tuo stile di trading e alle condizioni di mercato.
Progettato pensando al trader moderno, l'Indicatore Storico DXY HMA semplifica dati di mercato complessi in intuizioni azionabili, permettendoti di prendere decisioni di trading più intelligenti e sicure. Vivi il prossimo livello di analisi di mercato!
--------------------------
Sentiti libero di dare un'occhiata ai miei altri indicatori!
https://ctrader.com/products/1181
https://ctrader.com/products/1182
https://ctrader.com/products/1180
https://ctrader.com/products/1015
https://ctrader.com/products/555
https://ctrader.com/products/553
https://ctrader.com/products/554
https://ctrader.com/products/552
https://ctrader.com/products/557
https://ctrader.com/products/845
https://ctrader.com/products/848
https://ctrader.com/products/847
https://ctrader.com/products/846
https://ctrader.com/products/551
https://ctrader.com/products/574
https://ctrader.com/products/573
https://ctrader.com/products/556
https://ctrader.com/products/558
https://ctrader.com/products/559
https://ctrader.com/products/560