ACTO-v1
Indicateur
Version 1.0, Mar 2025
Windows, Mac
4.5
Avis : 2
Description
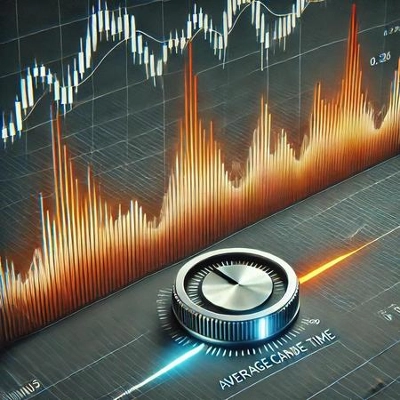
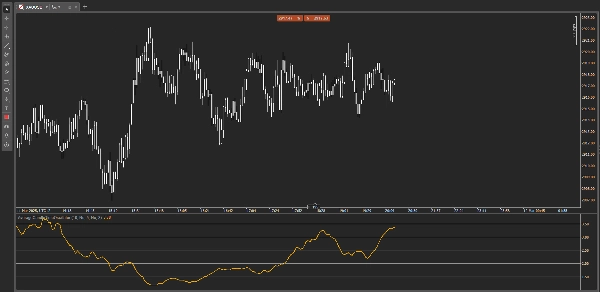
Oscillateur du Temps Moyen des Chandeliers (ACTO)
Améliorez vos performances de trading avec ACTO, l'oscillateur avancé qui analyse la durée moyenne des chandeliers du graphique, vous permettant d'identifier rapidement les changements de volatilité et d'activité du marché.
Pourquoi choisir ACTO ?
- Mesure Précise du Temps des Chandeliers : Détectez facilement les conditions de marché lentes ou rapides pour optimiser vos entrées et sorties.
- Seuil Personnalisable : Définissez des seuils spécifiques pour mettre en évidence les moments critiques et réagir rapidement aux changements du rythme du marché.
- Alertes Automatiques : Recevez des notifications immédiates lorsque la durée moyenne des chandeliers dépasse votre seuil défini, garantissant que vous ne manquez jamais d'opportunités de trading importantes.
- Interface Conviviale : Affichage simple et intuitif, adapté aux traders de tous niveaux.
Parfait pour le scalping, le day trading et le trading à court terme, ACTO est un outil essentiel pour tout trader cherchant à anticiper les mouvements significatifs du marché basés sur la dynamique du timing du marché.
Autres indicateurs
Résumé
Profil de l'indicateur
Avis clients
4.5
Avis : 2
5 | 50 % | |
4 | 50 % | |
3 | 0 % | |
2 | 0 % | |
1 | 0 % |
Avis clients
March 19, 2025
The product earns time when it gives the trader a reason to pause. Demo first makes more sense.
March 15, 2025
Bad impulses show up less often in the notes, but the market context still matters.
Discussion
Questions fréquentes
Scalping
Les produits disponibles sur cTrader Store, notamment les bots de trading, les indicateurs et les plug-ins, sont fournis par des développeurs tiers et mis à disposition à titre informatif et à des fins d'accès technique uniquement. cTrader Store n'est pas un courtier et ne fournit aucun conseil en investissement, aucune recommandation personnelle ni aucune garantie quant aux performances futures.
Plus de cet auteur


Prix
378.94M
Volume tradé
1.9M
Pips gagnés