Penerangan
Purata Bergerak Berbobot Kuantum (QWMA)
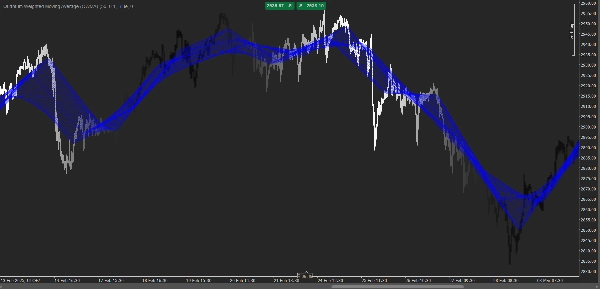
The Purata Bergerak Berbobot Kuantum (QWMA) ialah penunjuk perdagangan canggih yang direka untuk menyesuaikan pemberatan harga lalu secara dinamik berdasarkan keadaan pasaran. Berbeza dengan purata bergerak tradisional yang menggunakan pemberatan tetap, QWMA menggunakan fungsi peluruhan eksponen adaptif untuk memberikan kepentingan lebih kepada pergerakan harga terkini sambil masih mengambil kira data sejarah.
Ciri-ciri Utama:
✅ Pemberatan Adaptif: Menyesuaikan pengaruh harga lalu berdasarkan volatiliti dan kekuatan tren.
✅ Kepekaan Dipertingkatkan: Bertindak balas lebih cepat terhadap perubahan harga berbanding purata bergerak mudah dan eksponen.
✅ Pengurangan Bunyi: Membantu menapis bunyi pasaran sambil mengekalkan kejelasan tren.
✅ Parameter Boleh Disesuaikan: Membolehkan pedagang mengubah faktor peluruhan dan fungsi pemberatan untuk menyesuaikan strategi perdagangan yang berbeza.
Cara Ia Berfungsi:
QWMA menggunakan fungsi peluruhan eksponen ke atas data harga lalu, memastikan harga lama mempunyai pengaruh yang semakin berkurang manakala nilai terkini menyumbang dengan lebih ketara. Ini menghasilkan garis tren yang lebih lancar tetapi lebih responsif yang menyesuaikan diri dengan dinamik pasaran yang berubah.
Sesuai Untuk:
📈 Pengikut Tren – Mengenal pasti tren kuat dengan kelewatan minimum.
📉 Pedagang Ayunan – Mengesan pembalikan pasaran lebih awal daripada purata bergerak standard.
💹 Scalpers – Mendapatkan pandangan cepat mengenai perubahan momentum jangka pendek.
QWMA ialah alat yang kuat untuk pedagang yang mencari keseimbangan antara kelancaran dan kepekaan, menjadikannya sesuai untuk pelbagai pasaran kewangan, termasuk saham, forex, dan perdagangan kripto. 🚀
Ringkasan
Ulasan pelanggan
5 | 0 % | |
4 | 100 % | |
3 | 0 % | |
2 | 0 % | |
1 | 0 % |