present
ลงทะเบียนและรับส่วนลด $50 สำหรับการซื้อครั้งแรกของคุณ
Trading product for WhaleLiquidityProfile อินดิเคเตอร์ Key Levels Volume, image 1
WhaleLiquidityProfile
อินดิเคเตอร์
564 ดาวน์โหลด
เวอร์ชัน 1.0, May 2026
Windows, Mac
5.0
รีวิว: 2
Trading product for WhaleLiquidityProfile อินดิเคเตอร์ Key Levels Volume, image 2
28
การขาย
580
ติดตั้งฟรี

คำอธิบาย

โปรไฟล์สภาพคล่องและการดูดซับของวาฬ

ติดตามเงินสถาบัน วิเคราะห์การไหลของคำสั่ง และระบุโซนกลับตัวด้วยความแม่นยำเชิงปริมาณ

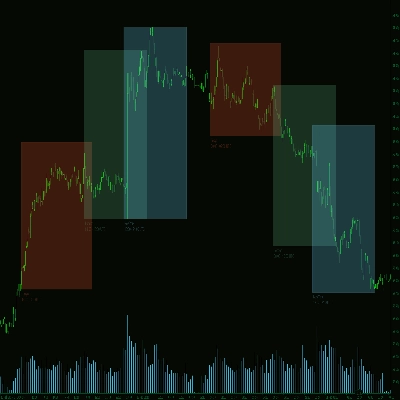
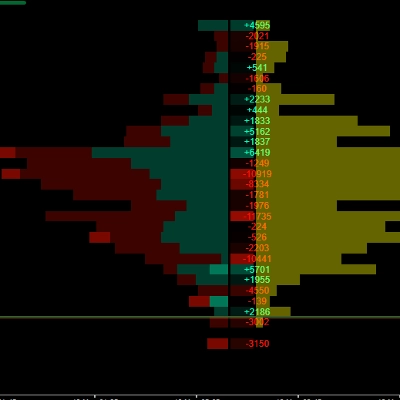
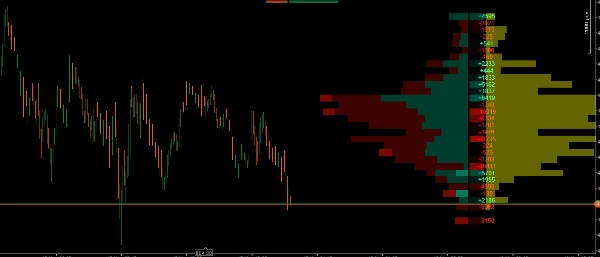
โปรไฟล์สภาพคล่องและการดูดซับของวาฬ ไม่ใช่โปรไฟล์ปริมาณแบบดั้งเดิมของคุณ มันคือชุดวิเคราะห์โครงสร้างตลาดที่แยกแยะทุกการทำธุรกรรมเพื่อแสดงให้คุณเห็นไม่เพียงแต่ ที่ไหน มีการซื้อขายปริมาณ แต่ยัง ใคร เป็นผู้ซื้อขาย (สถาบันเทียบกับรายย่อย) และ อย่างไร ราคามีปฏิสัมพันธ์ที่ระดับเหล่านั้น (ความก้าวร้าวเทียบกับการดูดซับ)

มันมีเครื่องยนต์การแสดงผลที่ปรับแต่งมาอย่างดีซึ่งฉายข้อมูลทั้งหมดไปทางขวาของราคาปัจจุบัน ทำให้กราฟของคุณสะอาดและไม่มีความล่าช้า

คุณสมบัติหลัก

  • ตัวกรองความแข็งแกร่ง (เฉพาะวาฬ): ใช้อัลกอริทึมเปอร์เซ็นไทล์ (เช่น อันดับสูงสุด 97%) เพื่อแยกปริมาณสถาบัน ("แข็งแกร่ง") ออกจากปริมาณรายย่อย ("อ่อนแอ") คุณสามารถสลับโหมด "เฉพาะแข็งแกร่ง" เพื่อแสดงเฉพาะรอยเท้าของเงินอัจฉริยะ
  • โปรไฟล์ปริมาณแบบซ้อน: แสดงการกระจายของปริมาณขาขึ้นและขาลงในแต่ละระดับราคาอย่างชัดเจน ทำให้ง่ายต่อการระบุจุดควบคุม (POC) และโหนดปริมาณสูง/ต่ำ (HVN/LVN)
  • การตรวจจับพื้นที่มูลค่าอัตโนมัติ: เน้นระดับราคาที่มีการซื้อขายปริมาณสูงสุด (ค่าเริ่มต้น 70%) โดยลดความสว่างของโซนรอบนอกเพื่อให้อ่านบริบทตลาดได้ง่ายในทันที
  • โปรไฟล์เดลต้า (แผนที่ความร้อน): คำนวณความแตกต่างที่แน่นอนระหว่างการซื้อขายตลาดและการขายตลาดในแต่ละระดับราคา รวมถึงค่าตัวเลขและแผนที่ความร้อนเพื่อระบุอย่างรวดเร็วว่าใครกำลังควบคุมอย่างก้าวร้าว
  • โปรไฟล์การดูดซับ (โซนสีเหลือง): วัดปริมาณที่ถูกกักขังเฉพาะในไส้เทียน ซึ่งช่วยให้คุณเห็นกราฟิกได้อย่างชัดเจนว่าเงินอัจฉริยะกำลังดูดซับสภาพคล่องจากผู้ค้ารายย่อยที่ติดกับดักตรงไหน
  • ประสิทธิภาพที่ปรับแต่ง: การคำนวณปริมาณหนักจะดำเนินการเฉพาะบนแท่งเทียนล่าสุด เพื่อให้แพลตฟอร์ม cTrader ของคุณทำงานได้อย่างราบรื่นและมีประสิทธิภาพ แม้ในกรอบเวลาที่ต่ำกว่า

วิธีใช้ตัวบ่งชี้นี้ในการเทรดของคุณ?

ตัวบ่งชี้นี้ให้การยืนยัน 3 ชั้นสำหรับการเทรดของคุณ นี่คือวิธีการรวมกันอย่างมีประสิทธิภาพ:

1. กำหนดบริบทด้วยโปรไฟล์ปริมาณและพื้นที่มูลค่า

  • ใช้โปรไฟล์ปริมาณเพื่อระบุว่าราคายอมรับสูงสุดที่ไหน (พื้นที่มูลค่าและ POC)
  • กลยุทธ์: มองหาโอกาสซื้อที่ด้านล่างของพื้นที่มูลค่า (แนวรับ) และโอกาสขายที่ด้านบนของพื้นที่มูลค่า (แนวต้าน)

2. ประเมินความก้าวร้าวด้วยโปรไฟล์เดลต้า

  • เมื่อราคาถึงระดับสำคัญของคุณ (เช่น โซนแนวรับ) ให้ดูที่คอลัมน์ เดลต้า
  • กลยุทธ์: หากคุณกำลังมองหาการซื้อที่แนวรับ คุณต้องการเห็นเดลต้าที่เป็นบวกอย่างมาก (สีเขียว) ที่ระดับนั้น ซึ่งบ่งชี้ว่าผู้ซื้อกำลังเข้ามาอย่างก้าวร้าว หากเดลต้ายังคงเป็นลบอย่างหนัก ผู้ขายยังคงครองตลาด

3. หาตัวกระตุ้นที่สมบูรณ์แบบด้วยโปรไฟล์การดูดซับ (หัวใจของตัวบ่งชี้)

  • นี่คือจุดที่เครื่องมือนี้โดดเด่นจริงๆ บ่อยครั้ง ตลาดดูเหมือนจะตกหนัก (เดลต้าลบแรง) แต่ราคากลับหยุดตก ทำไม? เพราะ "วาฬ" กำลังใช้คำสั่งจำกัดเพื่อ ดูดซับ แรงกดดันการขายทั้งหมดนั้น
  • กลยุทธ์ (เทรดกลับตัว): หากคุณเห็นราคาตกลงไปยังระดับสำคัญและเดลต้าเป็นลบ (ผู้ขายรายย่อยติดกับดัก) แต่ทันใดนั้นมีแท่งสีเหลืองขนาดใหญ่ปรากฏใน โปรไฟล์การดูดซับ นั่นหมายความว่าสถาบันเพิ่งดูดซับสภาพคล่องทั้งหมดในไส้เทียนนั้น นี่คือตัวกระตุ้นที่เหมาะสมที่สุดของคุณในการเข้าทางตรงกันข้าม!

4. ใช้ "ตัวกรองความแข็งแกร่ง" เพื่อตัดเสียงรบกวน

  • หากตลาดกำลังรวมตัวและทิศทางไม่ชัดเจน ให้เปิดใช้งานตัวเลือก "เฉพาะแข็งแกร่ง" ตัวนี้จะซ่อนเสียงรบกวนรายย่อยที่ไม่เกี่ยวข้องทั้งหมดและแสดงให้คุณเห็นอย่างชัดเจนว่าเงินทุนขนาดใหญ่กำลังสะสมหรือกระจายตำแหน่งของพวกเขาที่ไหน

สรุป

สรุปโดย AI
Whale Liquidity & Absorption Profile is a market microstructure indicator designed for detailed volume and order flow analysis. It distinguishes institutional ("whale") volume from retail activity using a percentile-based Strength Filter, enabling users to focus on smart money footprints. The indicator visually presents a stacked volume profile that separates bullish and bearish volume by price level, highlighting key areas such as the Point of Control (POC) and High/Low Volume Nodes (HVN/LVN). It automatically detects the Value Area, where the majority of volume is concentrated, to provide clear market context.

A Delta Profile heatmap calculates the net difference between market buys and sells at each price level, showing buyer or seller aggression. The Absorption Profile identifies volume trapped in candlestick wicks, revealing where institutional traders absorb liquidity from retail participants. The indicator’s optimized engine processes heavy volumetric calculations only on the latest candle, ensuring smooth performance on the cTrader platform.

Traders can use this tool to define market context, evaluate buying or selling aggression, and pinpoint reversal triggers based on absorption patterns. The "Strong Only" mode filters out retail noise during consolidation phases, focusing on institutional accumulation or distribution zones. This indicator supports volume and DOM data visualization to enhance decision-making around key support and resistance levels.
โปรไฟล์อินดิเคเตอร์
หมวดหมู่อินดิเคเตอร์
ปริมาณ
ประเภทเอาต์พุต
การแสดงเป็นภาพ
ข้อกำหนดด้านข้อมูล
ปริมาณ
DoM

รีวิวจากลูกค้า

5.0
รีวิว: 2
5
100 %
4
0 %
3
0 %
2
0 %
1
0 %
รีวิวจากลูกค้า
September 2, 2026
Excelente indicador.
May 21, 2026
Thanks for this sir, the delta and volume are depicted cleanly and accurately on this indicator. With the addition of absortion and filter settings for volume, it beats most in its class.

การสนทนา

คำถามที่พบบ่อย

Key Levels
Volume
Support & Resistance
ผลิตภัณฑ์ที่มีให้บริการผ่าน cTrader Store รวมถึงบอทการเทรด อินดิเคเตอร์ และปลั๊กอิน มีให้บริการโดยนักพัฒนาบุคคลที่สามและมีไว้เพื่อวัตถุประสงค์ในการเข้าถึงข้อมูลและทางเทคนิคเท่านั้น cTrader Store ไม่ใช่โบรกเกอร์และไม่ได้ให้คำแนะนำการลงทุน คำแนะนำส่วนบุคคล หรือการรับประกันผลการดำเนินงานในอนาคต

เพิ่มเติมจากผู้เขียนคนนี้

"RenkoProfit" โลโก้
ยอดนิยม
5.0
(2)
$20
/
$25
อินดิเคเตอร์
AI
Prop
+14
Professional Trading Indicator Transform Your Trading with Intelligent Signal Detection RenkoProfit
"Phoenix Zones" โลโก้
ยอดนิยม
4.6
(3)
$19
/
$38
อินดิเคเตอร์
AI
Prop
+9
Phoenix Zones - Detector de Reversiones Críticas
อินดิเคเตอร์
BOS
CHOCH
+5
Smart Money Concepts Automate your institutional analysis and make decisions with pinpoint precision..
อินดิเคเตอร์
AI-assisted
Predictive Monte Carlo Engine Forecast future price paths using institutional-grade statistical models and probability
อินดิเคเตอร์
BOS
VWAP
+4
Gold premiun XAUUSD Exclusive Real-Time Adaptive Intelligence
อินดิเคเตอร์
Liquidity Grab
Liquidity Sweep
+1
CRT Sweep Tracker is an advanced panel for Candle Range Theory (CRT) traders to track HTF sweeps and manage live trades.
อินดิเคเตอร์
Prop
Forex
+10
Heatmap Pro analiza la volatilidad, el volumen y la acción del precio para "pintar" tu gráfico con zonas de color.
อินดิเคเตอร์
Forex
BTCUSD
+11
Catch High-Probability Reversals with Precision Swing
อินดิเคเตอร์
ATR
Volume
+2
Heatmap Liquidity Zones Visualize volume-at-price, uncover hidden support/resistance, and track market liquidity in real
"Candlehtf" โลโก้
เรตติ้งสูง
4.2
(4)
$19
/
$20
อินดิเคเตอร์
SMC
Forex
+13
MultiFrameCandles para cTrader: La Herramienta Definitiva para Dominar Cualquier Marco de Tiempo
อินดิเคเตอร์
MSS
Market Structure
NY HTF Candles is a precision panel designed specifically for institutional traders
"ReversalGuard" โลโก้
เรตติ้งสูง
4.5
(4)
$19
อินดิเคเตอร์
ReversalGuard Pro: Domina el Mercado con Zonas de Soporte y Resistencia de Alta Precisión"

นอกจากนี้คุณยังอาจชอบ

อินดิเคเตอร์
ATR
RSI
+14
A metric that can set 1 to 3 groups of Bollinger Bands
อินดิเคเตอร์
Prop
Forex
+11
🧭 See when your market tends to move—by Month, Day-of-Week, or Hour-of-Day🧭
"Inside Candle" โลโก้
เรตติ้งสูง
4.5
(4)
$19
/
$20
อินดิเคเตอร์
ATR
RSI
+16
Highlight market consolidation zones instantly with this Inside Candle indicator — precise, clean, and powerful.
อินดิเคเตอร์
SMC
Forex
+5
Detect institutional breakout zones with smart volume & channel analysis — by PrimeQuant.
อินดิเคเตอร์
AI
ATR
+27
Support and Resistance with signals
อินดิเคเตอร์
RSI
Forex
+4
New version of one of my favorites includes Fibonacci and moving average convergence divergence lines
อินดิเคเตอร์
ATR
Volume
+3
Fibonacci trend signals on closed bars, with an ATR stop, up to four targets and a break-even ladder.
อินดิเคเตอร์
AI
ATR
+23
Candle Timer best used for Scalper
อินดิเคเตอร์
Crypto
Signal
+3
Candlestick Signal Finder: cTrader indicator that automatically detects and color-codes key Japanese candlestick pattern
อินดิเคเตอร์
BOS
EMA
+5
Free chart-overlay indicator for confirmed BOS, CHoCH and ATR-filtered Fair Value Gap analysis.
อินดิเคเตอร์
Ichimoku
COMPLETE ALERT SYSTEM - NEVER MISS A SIGNAL AGAIN
อินดิเคเตอร์
RSI
SMC
+17
RSI, MACD, Stochastic, CCI & Momentum divergence scanner with confluence scoring. Never miss a signal again!
"MultiScalpScorePRO" โลโก้
ยอดนิยม
4.3
(3)
$35
/
$70
อินดิเคเตอร์
ATR
RSI
+6
🔍 MultiScalpScorePRO – Powerful real-time scoring system combining indicators for ultra-precise scalping signals.
"Institutional Flow Radar" โลโก้
ยอดนิยม
4.5
(4)
$19
/
$29
อินดิเคเตอร์
Breakout
Institutional Flow Radar scans the chart for abnormal volume events and classifies them into two groups: Capital &Public
อินดิเคเตอร์
ATR
RSI
+5
Supply and demand zones with break of structure, higher timeframe MA signals, a percent stop and three targets.
อินดิเคเตอร์
Auto Fibonacci Retracement Indicator.
อินดิเคเตอร์
RSI
Forex
+3
🔹 Advanced RSI with smart alerts and visual signals for faster trend reversal detection.
อินดิเคเตอร์
Volume
Key Levels
+1
Fixed-grid volume profile: bull and bear volume at every price level, with Point of Control and value area.

ราคา

28
การขาย
580
ติดตั้งฟรี