
Market Sessions Advanced
Indicator
1.03K downloads
Version 1.0, Apr 2025
Windows, Mac
5.0
Reviews: 1
Description
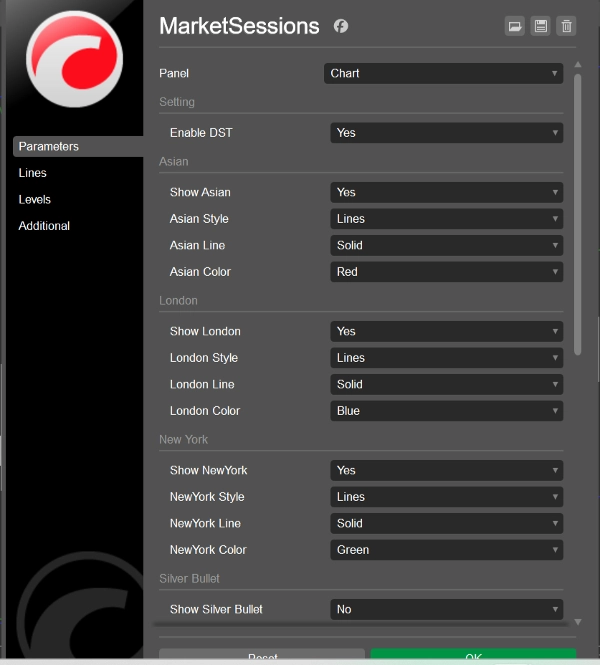
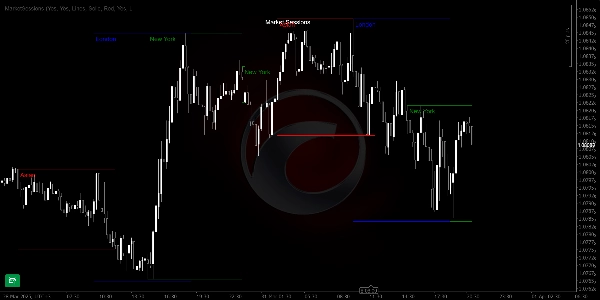
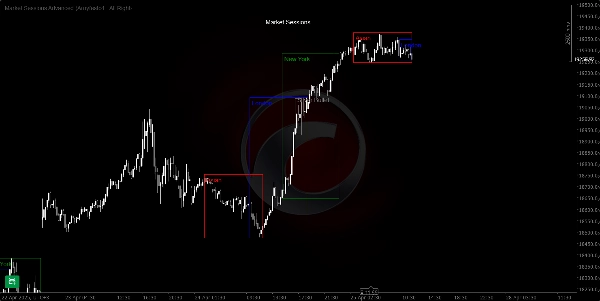
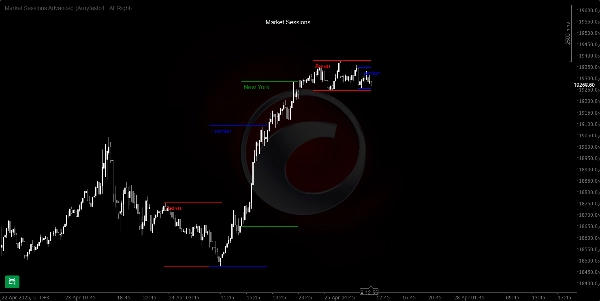
Advanced Market Sessions indicator with cool features like DST toggle and Daily, Weekly and Monthly also has ICT Killzones and ICT SilverBullet time windows.
Summary
AI summary
Market Sessions Advanced is an indicator designed for trading platforms that highlights market session times with enhanced features. It includes a daylight saving time (DST) toggle and displays daily, weekly, and monthly market sessions. The indicator incorporates ICT (Inner Circle Trader) Killzones and ICT SilverBullet time windows, which are specific time periods used by traders to identify potential market activity and trading opportunities. This tool supports analysis across multiple markets including forex, indices, commodities, cryptocurrencies, and stocks. It provides traders with a structured view of key trading sessions and time windows to assist in timing trades and market analysis.
Indicator profile
Customer reviews
5.0
Reviews: 1
5 | 100 % | |
4 | 0 % | |
3 | 0 % | |
2 | 0 % | |
1 | 0 % |
Customer reviews
August 12, 2025
Pros: Displays Tokyo, London, and New York sessions with advanced settings including DST and overlap zones. Clean visual design ideal for trading session awareness. Cons: No tooltips or alerts. Cannot save user presets. Lacks session log or interaction beyond static display.
Discussion
FAQ
Prop
Forex
Indices
Commodities
Crypto
Stocks
Products available through cTrader Store, including trading bots, indicators and plugins, are provided by third-party developers and made available for informational and technical access purposes only. cTrader Store is not a broker and does not provide investment advice, personal recommendations or any guarantee of future performance.


!["[Hamster-Coder] Moving Average MTF" logo](https://cdn.ctrader.com/image/webp/b11b98b1-194d-4b8e-b00e-d611826ad159_31226)


Price
1.13K
Free installs