
Описание
🔥 Pinescritlabs
Индикаторы Ctrader Store: 🤖Pinescritlabs Ctrader Store cBots:
Fair Value Gap Sessions Gold & BTC Breakout Session Pivots
Dynamic Market Structure
Анализ поворотных точек
Fibonacci Linear
Регрессия на нескольких таймфреймах
Multi-Level Candle Bias
Трекер
Auto Support and
Resistance Trend Lines
All Support and
Resistance Levels
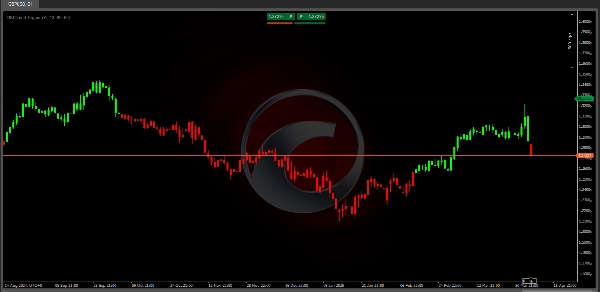
RSI Trend Trigger 📈✨
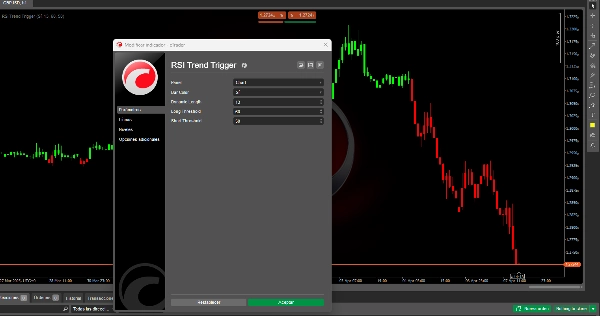
Как это работает? 🤔
Шаг 1: Традиционный RSI
Стандартный Индекс относительной силы (RSI) вычисляется, измеряя скорость и величину ценовых движений за заданный период. Он колеблется между 0 и 100, определяя зоны перекупленности (например, выше 70) и перепроданности (например, ниже 30). 📊📉📈
Шаг 2: Динамическая доработка
Традиционный RSI подвергается расширенному процессу сглаживания:
- Применяется второй математический расчет к исходным значениям RSI (не к самой цене).
- Этот шаг создает более стабильную версию RSI, уменьшая мелкие колебания (рыночный шум) и выделяя настоящие тренды.
- В отличие от базового сглаживания, этот метод сохраняет отзывчивость на значительные изменения импульса, избегая чрезмерных задержек. 🛡️🔄
Почему доработка важна? 🤩
- Умная фильтрация: устраняет ложные сигналы, вызванные временной волатильностью, такой как новостные всплески или спекулятивные движения. �🗑️
- Четкие тренды: подход с двойным расчетом различает мелкие коррекции и реальные развороты тренда. 🎯
- Устойчивые сигналы: после подтверждения тренда (бычьего/медвежьего) индикатор удерживает его до явного разворота, избегая резких скачков сигналов. 🔒
Практическое применение: пороги и принятие решений 📈
Доработанный RSI сочетается с двумя настраиваемыми порогами:
- Порог бычьего тренда (например, 60):
-
- Если доработанный RSI пересекает этот уровень сверху, подтверждается бычий тренд. 🚀
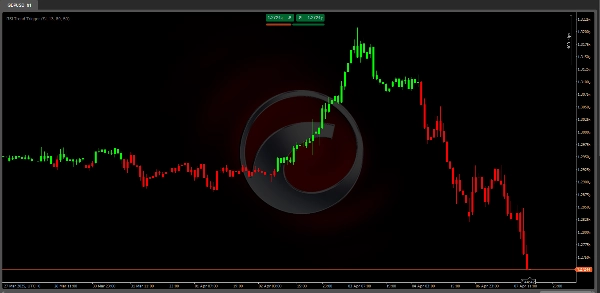
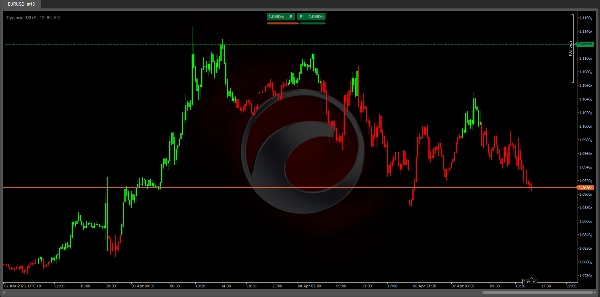
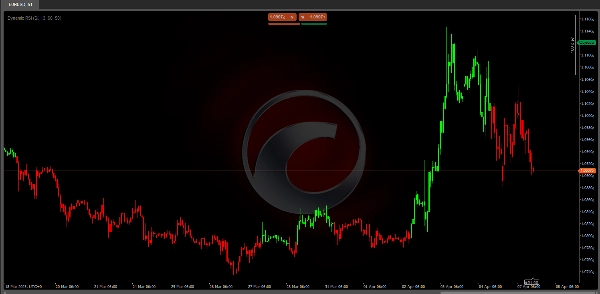
- Свечи становятся зелеными
- Порог медвежьего тренда (например, 50):
-
- Если доработанный RSI опускается ниже этого уровня, запускается медвежий тренд. 📉
- Свечи становятся красными
Ключевое правило:
- Сигналы появляются только при смене тренда (не при каждом колебании), снижая информационную перегрузку. 🚫📢
- Пороги настраиваемы: используйте более высокие значения (например, 65/55) для волатильных рынков или более низкие (например, 55/45) для плавных трендов. ⚙️
Преимущества для трейдеров 🏆
- Повышенная точность:
-
- Меньше ложных сигналов благодаря двухслойной фильтрации. Идеально для боковых рынков или ложных пробоев. ✅
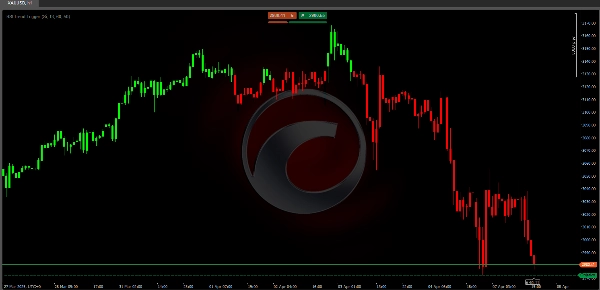
- Интуитивная визуализация:
-
- Цветные свечи и визуальные пороги позволяют мгновенно видеть тренды. 👀🎨
- Адаптивность:
-
- Работает с разными активами (форекс, акции, крипто) и таймфреймами (от минут до недель). 🌍⏳
- Торговля с фокусом на тренд:
-
- Помогает торговать по импульсу, избегая рискованных контртрендовых сделок. 🎯🚦
Пример потока сигналов
Представьте, что доработанный RSI находится на уровне 55 (нейтральная зона):
- Бычий сценарий: поднимается до 62 → пересекает порог 60 → свечи становятся зелеными🚀
- Медвежий сценарий: опускается до 48 → пробивает порог 50 → свечи становятся красными📉
Сводка
The indicator then applies an advanced smoothing process to the RSI values, not the price data, creating a refined RSI that reduces minor market noise while maintaining sensitivity to significant momentum changes. This dual-layer calculation enhances signal precision by filtering out false signals caused by temporary volatility and distinguishing between minor corrections and genuine trend reversals.
Users can customize two threshold levels—a bullish threshold (e.g., 60) and a bearish threshold (e.g., 50)—to define when a trend is confirmed. When the refined RSI crosses above the bullish threshold, the indicator signals a bullish trend with green candles; when it falls below the bearish threshold, it signals a bearish trend with red candles. Signals appear only during trend changes, reducing information overload.
The RSI Trend Trigger supports multiple timeframes from minutes to weeks and is adaptable to different market conditions, aiding traders in aligning with momentum and avoiding counter-trend risks.
Отзывы покупателей
5 | 67 % | |
4 | 33 % | |
3 | 0 % | |
2 | 0 % | |
1 | 0 % |


