คำอธิบาย
CurrencyMeter kNN เป็นมาตรวัดความแข็งแกร่งของสกุลเงินหลายสกุลที่สร้างขึ้นสำหรับเทรดเดอร์ที่ต้องการมุมมองที่ชัดเจนของการไหลของสกุลเงิน และชั้นการเรียนรู้ของเครื่องที่เรียบง่ายเพื่อประเมินความน่าจะเป็นของการกลับสู่ค่าเฉลี่ย
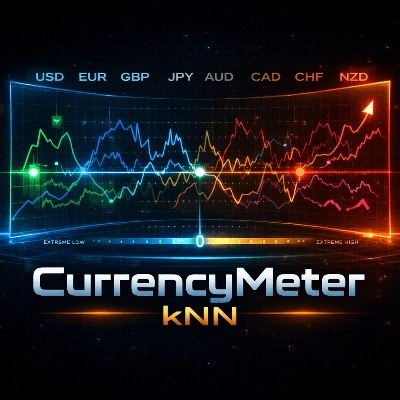
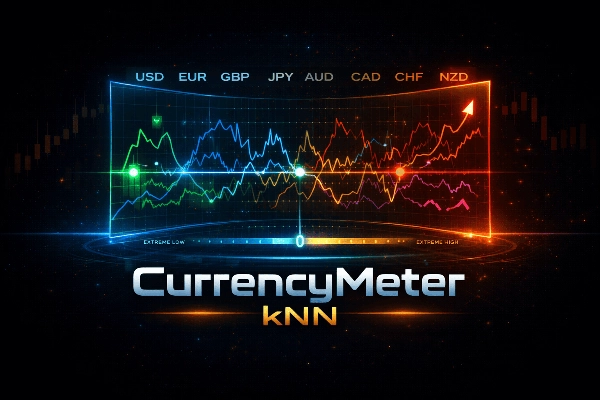
แตกต่างจากตัวชี้วัดแบบคลาสสิก มันคำนวณความแข็งแกร่งสำหรับสกุลเงินหลัก 8 สกุล (USD, EUR, GBP, JPY, AUD, CAD, CHF, NZD) โดยการรวบรวมข้อมูลจากคู่สกุลเงินทั้งหมด จากนั้นทำการปรับให้เป็นมาตรวัดที่กะทัดรัด มันใช้คุณสมบัติเฉพาะ (เช่น ผลตอบแทน % ในช่วงเวลาหมุนเวียนหลายช่วง และอีก 5 คุณสมบัติที่จะเก็บเป็นความลับ)
วิธีการทำงาน:
- การรวบรวมหลายคู่: สำหรับแต่ละสกุลเงิน มาตรวัดจะรวบรวมคุณสมบัติหน้าต่างหมุนเวียนที่ทับซ้อนกันหลายรายการ ซึ่งจะสร้างค่า “แรงกดดันของสกุลเงิน” เฉลี่ยต่อสกุลเงิน
- การตรวจจับค่าผิดปกติด้วยเกณฑ์แบบไดนามิก: ตลาดไม่คงที่: คุณสมบัติทางสถิติของราคา/ผลตอบแทนเปลี่ยนแปลงตามเวลา (ความผันผวน, สภาพคล่อง, วัฏจักรมหภาค, ช่วงเวลา) เกณฑ์คงที่มักล้มเหลวเพราะสิ่งที่ถือว่า “ผิดปกติ” ในสภาวะหนึ่งอาจไม่ใช้ได้ในสภาวะอื่น
เพื่อ ลดความไม่เสถียรนั้น โมเดลใช้เกณฑ์แบบไดนามิกที่คำนวณจากการแจกแจงล่าสุดของมาตรวัด มันประเมิน “ค่าผิดปกติ” เป็นส่วนหางบนสุดของค่าที่แน่นอนล่าสุด (ตามเปอร์เซ็นไทล์) ซึ่งเปลี่ยนสัญญาณดิบให้ใกล้เคียงกับพฤติกรรมที่คงที่มากขึ้น ซึ่งง่ายต่อการสร้างแบบจำลองและเรียนรู้จาก kNN
- โมเดลง่ายๆ kNN (ML โปร่งใส): ตัวจำแนกประเภท k-Nearest Neighbors (kNN) ถูกใช้เพื่อประเมินว่าสภาวะผิดปกติมีแนวโน้มที่จะกลับสู่ค่าเฉลี่ยภายในช่วงเวลาที่กำหนดหรือไม่
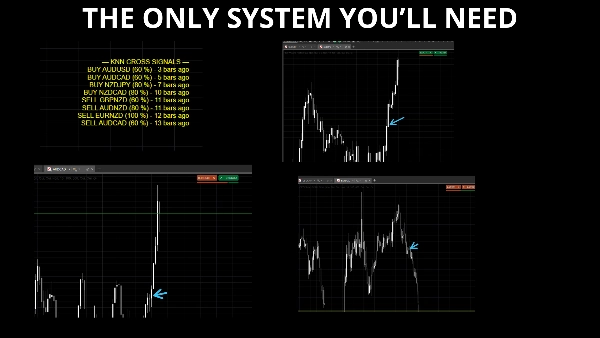
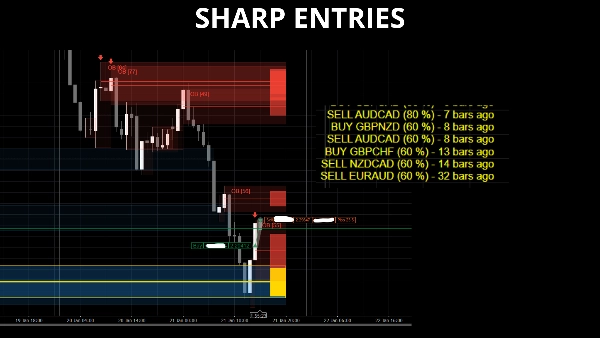
เมื่อความน่าจะเป็นเกินเกณฑ์ความเชื่อมั่น ตัวชี้วัดจะแสดงสัญญาณทิศทาง: ซื้อ X/Y หรือ ขาย X/Y
คุณสมบัติ:
- สกุลเงินหลัก 8 สกุลแสดงในแผงเดียว
- การรวบรวมหลายคู่
- เกณฑ์ “ผิดปกติ” แบบไดนามิกตามการแจกแจงล่าสุด
- ชั้นความน่าจะเป็น kNN สำหรับอคติการกลับสู่ค่าเฉลี่ย
- ลูกศรบนแผงที่คงที่สำหรับสัญญาณล่าสุด
หมายเหตุ:
- นี่เป็นวิธีการ ML ที่เรียบง่ายและโปร่งใสโดยเจตนา (kNN) ไม่ใช่กล่องดำ
- เป้าหมายไม่ใช่ “การทำนาย” (ซึ่งตามคำนิยามเป็นไปไม่ได้สำหรับเทรดเดอร์รายย่อย) แต่เป็นการตอบสนอง: การระบุเมื่อสกุลเงินมีการยืดออกทางสถิติเกินกว่าพฤติกรรมล่าสุดของตนเอง


