
คำอธิบาย
ภาพรวม
ตัวบ่งชี้ Balance of Power วัดความแข็งแกร่งของผู้ซื้อเทียบกับผู้ขายโดยประเมินความสามารถของแต่ละฝ่ายในการผลักดันราคาสู่ระดับสูงสุดหรือต่ำสุด
แนะนำโดย Igor Levshin ในฉบับเดือนสิงหาคม 2001 ของ Technical Analysis of Stocks & Commodities นิตยสาร BOP คำนวณอัตราส่วนของการเคลื่อนไหวของราคาภายในช่วงของแต่ละแท่งเพื่อเปิดเผยพลวัตความแข็งแกร่งภายในที่ไม่ขึ้นกับทิศทางราคา
แนวคิด
Balance of Power วัดตำแหน่งที่ราคาปิดภายในช่วงของแต่ละแท่งเพื่อเปิดเผยการต่อสู้ภายในระหว่างผู้ซื้อและผู้ขาย
หลักการพื้นฐานนั้นง่าย: ผู้ซื้อผลักดันราคาไปทางสูงสุด ผู้ขายผลักดันไปทางต่ำสุด ตำแหน่งที่ราคาปิดในช่วงนั้นเผยให้เห็นว่าใครเป็นฝ่ายครอบงำช่วงเวลาการซื้อขาย
ค่าดิบจะถูกปรับให้เรียบด้วยค่าเฉลี่ยเคลื่อนที่เพื่อลดเสียงรบกวนและเปิดเผยแรงกดดันในทิศทางที่ยั่งยืน เปลี่ยนการอ่านค่าที่ไม่แน่นอนแท่งต่อแท่งให้เป็นเกจวัดโมเมนตัมที่ชัดเจนซึ่งติดตามการเปลี่ยนแปลงในการควบคุมตลาด
การประยุกต์ใช้โครงสร้างตลาด
BOP ให้การวิเคราะห์ความแข็งแกร่งภายในที่สามารถยืนยันหรือขัดแย้งกับโครงสร้างราคา:
การระบุช่วงแนวโน้ม
- แนวโน้มขาขึ้นที่แข็งแกร่ง: BOP อยู่เหนือศูนย์อย่างต่อเนื่องพร้อมกับจุดต่ำที่สูงขึ้น
- แนวโน้มขาลงที่แข็งแกร่ง: BOP อยู่ต่ำกว่าศูนย์อย่างต่อเนื่องพร้อมกับจุดสูงที่ต่ำลง
- การรวมตัว: BOP แกว่งรอบเส้นศูนย์
- โซนเปลี่ยนผ่าน: BOP ทำลายโครงสร้างก่อนหน้า (สูงสุดสูงขึ้น/ต่ำสุดต่ำลง)
การรวมกันของแนวรับ/แนวต้าน
- BOP กลับสู่ศูนย์บ่อยครั้งสอดคล้องกับการทดสอบระดับสำคัญของราคา
- การอ่านค่าขั้นสูงของ BOP (+0.8 ถึง +1.0 หรือ -0.8 ถึง -1.0) อาจบ่งชี้ถึงความเหนื่อยล้าใกล้โครงสร้าง
- ความเบี่ยงเบนที่ระดับโครงสร้างบ่งชี้ถึงการปฏิเสธหรือการทะลุผ่านที่เป็นไปได้
การกระจาย/การสะสม
- ราคาขึ้นพร้อมกับ BOP ลดลง: ช่วงการกระจายที่เป็นไปได้
- ราคาลงพร้อมกับ BOP เพิ่มขึ้น: ช่วงการสะสมที่เป็นไปได้
- ความเบี่ยงเบนเหล่านี้สำคัญที่สุดใกล้ระดับโครงสร้างหลัก
กลยุทธ์หลายกรอบเวลา
การใช้ BOP ข้ามกรอบเวลาช่วยให้มีบริบทและความแม่นยำ:
1. กรอบเวลาสูงกว่า (HTF) - แนวโน้มทิศทาง:
- BOP รายวัน/4 ชั่วโมง อยู่เหนือศูนย์ → มองหาโอกาสซื้อในกรอบเวลาต่ำกว่า
- BOP รายวัน/4 ชั่วโมง อยู่ต่ำกว่าศูนย์ → มองหาโอกาสขายในกรอบเวลาต่ำกว่า
- BOP HTF ข้ามศูนย์ → การเปลี่ยนแปลงแนวโน้มหลัก รอการยืนยัน
2. กรอบเวลาต่ำกว่า (LTF) - การจับเวลาการเข้า:
- BOP 1 ชั่วโมง/15 นาที สอดคล้องกับ HTF → การตั้งค่าความน่าจะเป็นสูง
- การตัดกันของ BOP/สัญญาณใน LTF ตามทิศทาง HTF → ทริกเกอร์เข้า
- การขยายฮิสโตแกรม LTF ยืนยันโมเมนตัม
3. การจัดแนวกรอบเวลา:
- กรอบเวลาทั้งหมดเห็นพ้อง → การเทรดที่มั่นใจที่สุด
- HTF และ LTF เบี่ยงเบน → รอการแก้ไขหรือหลีกเลี่ยงการเทรด
- การกลับตัวของ LTF ต้าน HTF → การเก็บกำไรแบบสวนเทรนด์เท่านั้น
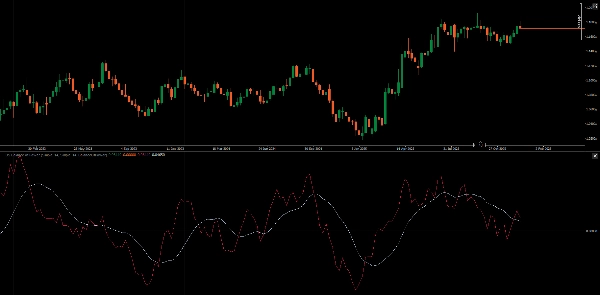
เส้นสัญญาณ & ฮิสโตแกรม
เส้นสัญญาณ (MA ของ BOP):
- การตัดกันของ BOP/สัญญาณให้สัญญาณเข้า/ออกที่กรองแล้ว
- ความชันของเส้นสัญญาณบ่งชี้ความต่อเนื่องของโมเมนตัม
- ระยะห่างระหว่าง BOP กับสัญญาณแสดงการขยายตัวของการเคลื่อนไหว
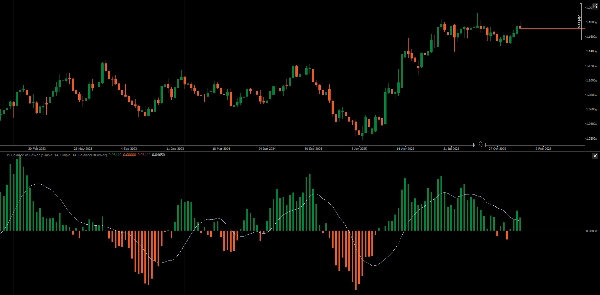
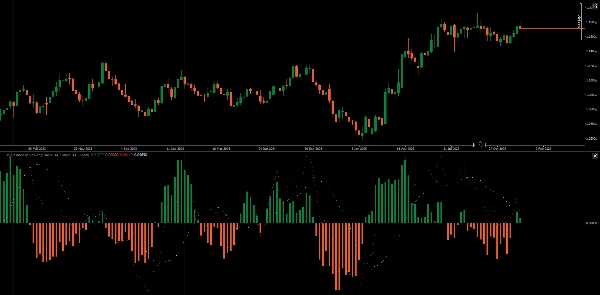
โหมดฮิสโตแกรม:
- โหมดค่า: แสดงขั้ว BOP เทียบกับศูนย์ (การครอบงำของผู้ซื้อ/ผู้ขาย)
- โหมดสัญญาณ: แสดงความแตกต่างระหว่าง BOP - สัญญาณ เปิดเผยการเปลี่ยนแปลงโมเมนตัมก่อนการตัดกัน
ในโหมดสัญญาณ การตัดกันของเส้นศูนย์ของฮิสโตแกรมเกิดขึ้นก่อนการตัดกันของเส้น BOP/สัญญาณ ให้การเตือนล่วงหน้าของการเปลี่ยนแปลงโมเมนตัม
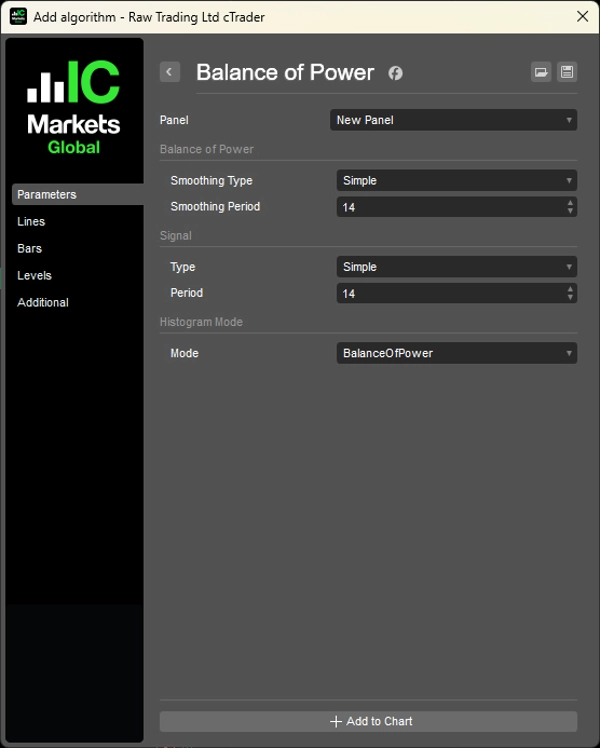
คุณสมบัติ
- ช่วงการปรับเรียบ: ปรับช่วง MA สำหรับ BOP (ค่าเริ่มต้น 14)
- ประเภทการปรับเรียบ: เลือกประเภท MA (SMA, EMA, ฯลฯ)
- ช่วงสัญญาณ: ปรับช่วง MA สำหรับเส้นสัญญาณ (ค่าเริ่มต้น 14)
- ประเภทสัญญาณ: เลือกประเภท MA สำหรับเส้นสัญญาณ
- โหมดฮิสโตแกรม: สลับระหว่างการแสดงค่าความแตกต่างของสัญญาณ
ตัวอย่างใช้งานจริง
- HTF (รายวัน): BOP อยู่เหนือศูนย์และเพิ่มขึ้น → แนวโน้มขาขึ้น
- ราคาย่อตัวลงสู่แนวรับ
- LTF (1 ชั่วโมง): BOP ตัดขึ้นเหนือสัญญาณ → ทริกเกอร์เข้า
- ฮิสโตแกรม (โหมดสัญญาณ) ขยาย → ยืนยันการเร่งโมเมนตัม
- ออกเมื่อฮิสโตแกรม LTF หดตัวหรือ BOP ตัดลงต่ำกว่าสัญญาณ
__________________________________________________________________________________________
ตัวบ่งชี้ฟรีเพิ่มเติม
สำรวจเครื่องมือวิเคราะห์ตลาดหลากหลายประเภท—ตั้งแต่โครงสร้างและปริมาณไปจนถึงการถดถอย ความผันผวน และกรอบเวลาที่กำหนดเอง
ซอร์สโค้ดมีให้บน GitHub repository.
ทั้งหมดใช้ฟรี แต่ถ้าคุณต้องการสนับสนุนด้วยกาแฟ คุณสามารถส่งได้ ที่นี่.
แนวรับ/แนวต้าน
ปริมาณ
- Volume Activity Profiler
- Volume Efficiency Analyzer
- Volume Profile Analytics
- Volume Profile - Updated
- Volume Spread Analysis
- VWAP (Volume Weighted Average Price)
ค่าเฉลี่ยเคลื่อนที่
- SSL Channel
- Anchored Moving Average
- Deviation-Scaled Moving Average
- Gann High Low Activator
- Instantaneous Trendline
- Kaufman Adaptive MA with Trend Vision
- Moving Average Channel
- Moving Averages Suite
- Trend Channel Moving Average
ยูทิลิตี้/กำหนดเอง
อิงการถดถอย
ความผันผวน
ออสซิลเลเตอร์
__________________________________________________________________________________________
ข้อจำกัดความรับผิดชอบ
การซื้อขายมีความเสี่ยง ตัวบ่งชี้นี้มีไว้สำหรับการวิเคราะห์ทางเทคนิคเท่านั้น — โปรดใช้การจัดการความเสี่ยงอย่างเหมาะสมและซื้อขายอย่างรับผิดชอบเสมอ
ข้อเสนอแนะ & การปรับปรุง
หากคุณมีข้อเสนอแนะ คำขอฟีเจอร์ หรือไอเดียสำหรับการปรับปรุง โปรดแสดงความคิดเห็นในแท็บ Discussion ข้อเสนอแนะของคุณช่วยปรับปรุงตัวบ่งชี้สำหรับทุกคน
สรุป
Key functionalities include identifying trend phases—strong uptrends, downtrends, consolidation, and transition zones—by observing BOP behavior relative to the zero line. It also aids in detecting support and resistance confluence, with extreme BOP readings indicating potential exhaustion near key levels and divergences signaling possible rejections or breakthroughs. The indicator helps identify distribution and accumulation phases through price and BOP divergences.
BOP supports multi-timeframe analysis: higher timeframes provide directional bias, while lower timeframes offer entry timing signals via BOP and signal line crossovers and histogram momentum confirmation. The signal line is a moving average of BOP, with crossovers serving as filtered entry/exit triggers. The histogram can display either BOP polarity or the difference between BOP and its signal line, offering early momentum shift warnings.
Adjustable parameters include smoothing periods and types for both BOP and signal lines, and histogram display modes. The indicator is applicable across Forex, indices, commodities, cryptocurrencies, and stocks markets.


