
Descrizione
L'indicatore si basa sull'analisi della price action 📈 per identificare cambiamenti nella struttura del mercato e aree chiave di interesse. Di seguito un riepilogo dettagliato di come funziona:
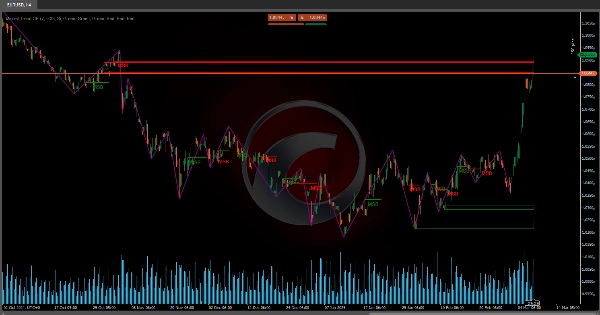
Rilevamento dei Punti Pivot e Formazione dello Zigzag 🔄
Viene analizzato un periodo specifico (definito da un parametro di lunghezza) per identificare massimi e minimi relativi. Confrontando i prezzi all'interno di tale intervallo, i punti pivot (punti di inflessione) vengono rilevati, i quali, a loro volta, formano il modello zigzag ⚡. Questo modello aiuta a distinguere quando si verifica un inversione di prezzo .
Accumulo di Volume e Calcolo della Deviazione 📊
Durante il processo di rilevamento dei pivot, il tick volume viene accumulato nel segmento valutato. Inoltre, viene calcolata la differenza percentuale tra i prezzi dei pivot per determinare se il movimento è sufficientemente significativo. Questa deviazione viene confrontata con una soglia definita, che aiuta a confermare che il cambiamento nella struttura è reale ✅.
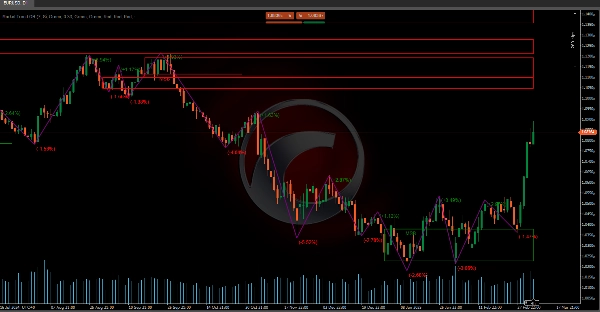
Definizione della Rottura della Struttura di Mercato (MSB) 🚨
L'indicatore valuta gli ultimi due pivot (sia massimi che minimi) e, applicando un fattore di ritracciamento (ispirato ai livelli di Fibonacci), determina se si è verificata una rottura della struttura .
- Se, dopo aver superato un vecchio massimo, il prezzo inizia a generare minimi più bassi, si identifica un passaggio a una struttura ribassista 🐻.
- Analogamente, se dopo aver superato un vecchio minimo, il prezzo genera massimi più alti, si assume una transizione a una struttura rialzista 🐂.
Questo cambiamento è interpretato come una Rottura della Struttura di Mercato (MSB).
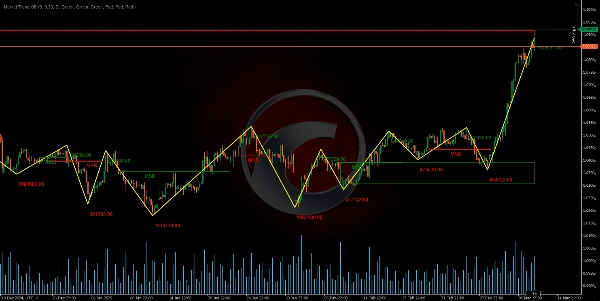
Identificazione di Blocchi d'Ordine e Box di Rottura 📦
Una volta rilevata una MSB, vengono definite zone critiche basate sulla precedente azione di prezzo:
- Blocchi d'Ordine (OB) 🧱: Questi sono identificati come zone dove si è verificata l'ultima azione significativa prima della rottura. In una struttura ribassista, si prende l'ultima candela rialzista prima del nuovo massimo; in una struttura rialzista, si usa l'ultima candela ribassista prima del nuovo minimo.
- Box di Rottura (BB) 📈: Questi sono determinati in modo simile ma considerano un intervallo aggiuntivo per confermare che il prezzo ha superato il livello precedente.
Queste zone aiutano a definire aree dove l'attività è concentrata e possono agire come supporto o resistenza in futuro.
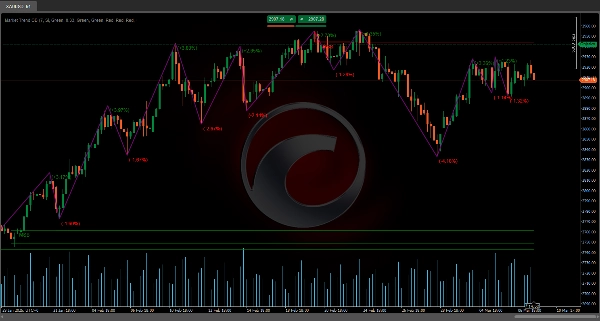
Visualizzazione dei Dati Rilevanti dello Zigzag 📊
Oltre a tracciare la sequenza dei pivot, l'indicatore incorpora dati aggiuntivi:
- Prezzo di Inversione 💹: Viene registrato il valore esatto in cui viene rilevato il cambiamento di trend.
- Variazione Percentuale di Inversione 🔄: Viene calcolata la variazione percentuale tra il nuovo prezzo pivot e quello precedente, indicando l'entità del cambiamento.
- Volume Accumulato 📉: Viene mostrata la somma del tick volume durante il segmento che porta alla formazione del pivot.
Questi dati permettono di valutare la forza e rilevanza del movimento senza affidarsi a supposizioni, poiché si basano su calcoli concreti.
In sintesi, lo strumento analizza la price action per rilevare quando il mercato cambia trend (MSB) e definisce zone (blocchi d'ordine e box di rottura) che possono essere chiave per decisioni di trading 💼. L'integrazione del modello zigzag con l'analisi del volume e le deviazioni percentuali offre una visione completa della struttura di mercato, fornendo informazioni precise sui punti di inversione e sulla forza del movimento 💪.
Indicatori del Ctrader Store:
Dynamic Market Structure
Analysis of Turning Points
Fibonacci Linear
Regression Multi-timeframe
Multi-Level Candle Bias
Tracker
Auto Support and
Resistance Trend Lines
Riepilogo
It defines Market Structure Breaks (MSB) by evaluating recent pivots with a retracement factor inspired by Fibonacci levels. A break in structure is signaled when price action shifts from higher highs to lower lows (bearish) or from lower lows to higher highs (bullish).
Upon detecting an MSB, the indicator identifies critical zones: Order Blocks (OB), representing the last significant candle before a breakout, and Breakout Boxes (BB), which confirm price level breaches with an additional range. These zones serve as potential future support or resistance areas.
The tool visualizes relevant zigzag data, including reversal prices, percentage changes, and accumulated volume, enabling assessment of movement strength and relevance based on concrete calculations. This comprehensive approach integrates zigzag patterns, volume analysis, and deviation metrics to provide precise information on reversal points and market movement strength, supporting informed trading decisions.
Recensioni dei clienti
5 | 100 % | |
4 | 0 % | |
3 | 0 % | |
2 | 0 % | |
1 | 0 % |


