
Descripción
📌 Descripción para la tienda cTrader – Francés 🇫🇷
🔍 Indicador [LDE] OPR & Market Sessions – ¡Visualización clara de las sesiones!
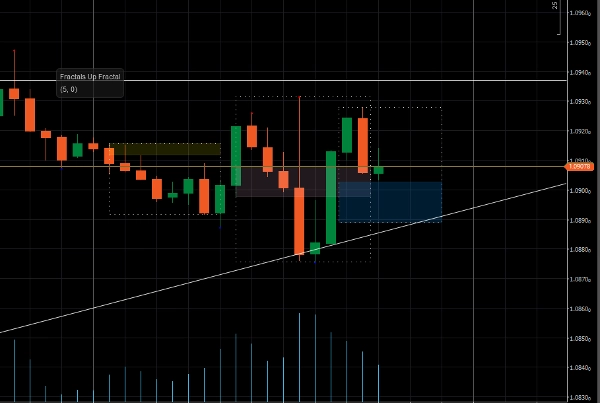
Este indicador resalta las sesiones principales del mercado (Tokio, Londres, Nueva York) mostrando rectángulos dinámicos en su gráfico.
✔ Visualización personalizable de las sesiones 🏙️
✔ Visualización de los niveles High/Low por sesión 📈
✔ Resaltado del Rango de Precio de Apertura (OPR) ⏳
✔ Transparencia ajustable para mejor legibilidad 🎨
✔ Compatible con todos los activos y marcos temporales ⏰
🔧 Configuraciones flexibles: active/desactive cada sesión, ajuste los colores y personalice la visualización de High/Low para cada sesión.
🚀 ¡Optimice su trading identificando las zonas clave del mercado de un vistazo!
📌 Descripción para la tienda cTrader – Inglés 🇬🇧
🔍 [Indicador [LDE] OPR & Market Sessions – ¡Visualización clara de las sesiones!
Este indicador resalta las principales sesiones del mercado (Tokio, Londres, Nueva York) mostrando rectángulos dinámicos en su gráfico.
✔ Visualización personalizable de sesiones 🏙️
✔ Visualización específica de High/Low por sesión 📈
✔ Resaltado del Rango de Precio de Apertura (OPR) ⏳
✔ Transparencia ajustable para mejor legibilidad 🎨
✔ Compatible con todos los activos y marcos temporales ⏰
🔧 Configuraciones flexibles: active/desactive cada sesión, ajuste los colores y personalice la visualización de High/Low para cada sesión.
🚀 ¡Optimice su trading identificando las zonas clave del mercado de un vistazo!
Resumen
Valoraciones de clientes
5 | 0 % | |
4 | 100 % | |
3 | 0 % | |
2 | 0 % | |
1 | 0 % |


![Logotipo de "[Stellar Strategies] Market Session Ultimate"](https://cdn.ctrader.com/image/webp/61ffd537-0125-4246-9e72-42eca1791d64_28232)


