
Descripción
https://chartshots.spotware.com/c/695bff3f3bc21
https://chartshots.spotware.com/c/695bffac03fb1
https://chartshots.spotware.com/c/695c0002aabb7
📊 Auto Fib Retracement
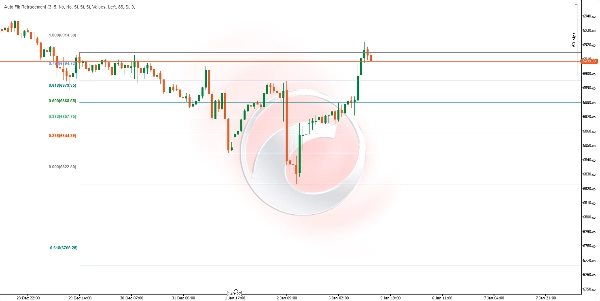
Auto Fib Retracement es un indicador de análisis técnico que traza automáticamente los niveles de retroceso y extensión de Fibonacci basándose en los movimientos de precio significativos más recientes. A diferencia de las herramientas manuales de Fibonacci, este indicador detecta automáticamente los puntos pivote del mercado y actualiza los niveles en tiempo real.
⚙️ ¿Cómo Funciona?
Detección Automática de Pivotes
El indicador utiliza un algoritmo dinámico ZigZag para identificar los máximos y mínimos significativos de precio:
- Lookback (Profundidad): Define cuántas barras se analizan hacia atrás para confirmar un punto pivote. Un valor más alto detecta oscilaciones mayores; un valor más bajo es más sensible a movimientos menores.
- Sensibilidad (Desviación): Controla cuán significativo debe ser un movimiento de precio para formar un nuevo pivote. Se calcula multiplicando el ATR de 10 períodos (Rango Verdadero Promedio) por este factor. Valores más altos filtran el ruido y solo detectan movimientos importantes.
Cálculo de Niveles de Fibonacci
Una vez identificados los dos pivotes más recientes (un máximo y un mínimo), el indicador calcula cada nivel usando la fórmula clásica de Fibonacci:
Nivel = Precio Ancla + (Rango de Movimiento × Ratio de Fibonacci)
Donde:
- Precio Ancla: El precio del pivote más reciente (o el anterior si la dirección se invierte)
- Rango de Movimiento: La diferencia entre los dos pivotes
- Ratios Disponibles: 0, 0.236, 0.382, 0.5, 0.618, 0.65, 0.786, 1, 1.272, 1.414, 1.618, 1.65, 2.618, 2.65, 3.618, 3.65, 4.236, 4.618, y niveles negativos (-0.236, -0.382, -0.618, -0.65)
📈 ¿Para Qué Sirve?
UseDescription
Identificar Soportes y Resistencias
Los niveles 0.382, 0.5, y 0.618 son zonas clásicas donde el precio tiende a reaccionar 🔵
Definir Objetivos de Precio
Los niveles de extensión (1.618, 2.618, 3.618, 4.236) ayudan a proyectar hasta dónde podría llegar un movimiento 🎯
Planificar Entradas
Busca retrocesos a niveles clave para entrar en la dirección de la tendencia ⬆️⬇️
Establecer Stop-Loss
Coloca stops más allá de niveles relevantes de Fibonacci 🛑
Confirmar Zonas de Reversión
Cuando el precio alcanza niveles extremos de extensión, puede indicar agotamiento 🔄
🛠️ Cómo Usarlo
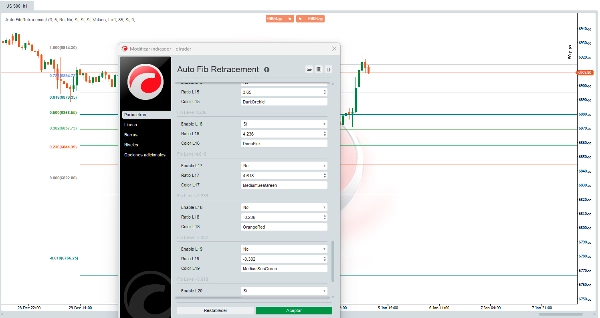
Parámetros Principales
ParámetroDescripciónValor Sugerido
Sensibilidad
Multiplicador de desviación para filtrar movimientos menores
3 (predeterminado)
Lookback
Número mínimo de barras para calcular pivotes
10 (predeterminado)
Invertir Dirección
Invierte el punto de referencia para el cálculo de niveles
Desactivado
Opciones de Visualización
OpciónFunción
Extender Izquierda / Derecha
Extiende las líneas horizontales hacia la izquierda o derecha del gráfico
Mostrar Precios
Muestra el precio exacto de cada nivel
Mostrar Ratios
Muestra el ratio de Fibonacci (valores o porcentaje)
Posición de Etiqueta
Posiciona las etiquetas a la izquierda o derecha
Opacidad de Zona
Controla la transparencia de las zonas coloreadas entre niveles
Niveles de Fibonacci Configurables
Cada uno de los 22 niveles puede ser:
- Activado o desactivado individualmente
- Modificado en su valor numérico
- Cambiado de color
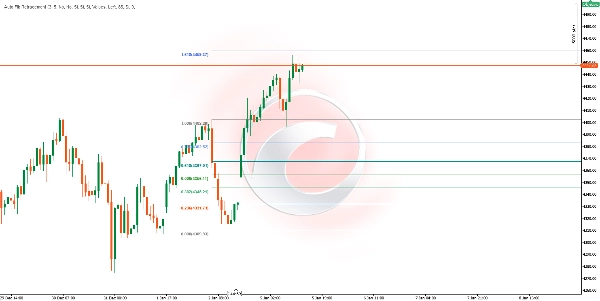
💡 Interpretando las Zonas
Las zonas coloreadas entre niveles consecutivos facilitan la identificación visual:
- Zonas Verde/Azul (0.382 - 0.786): Área de retroceso saludable en tendencias. Zona común para buscar entradas. ✅
- Zona Nivel 1.0: Representa el 100% del movimiento previo. Actúa como soporte/resistencia clave. ⚖️
- Zonas Rojo/Rosa (1.618+): Extensiones del movimiento. El precio que alcanza estas zonas puede indicar sobre-extensión. ⚠️
⚠️Consideraciones
- El indicador se actualiza automáticamente cuando detecta nuevos pivotes significativos
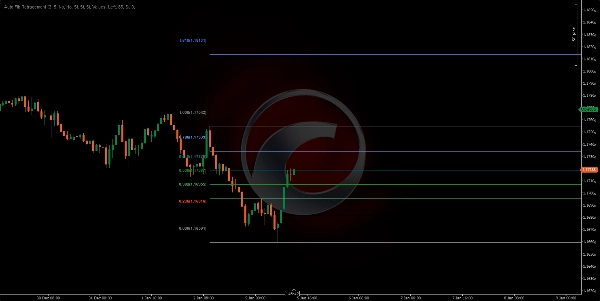
- Funciona en cualquier marco temporal y activo financiero
- Los niveles de Fibonacci son zonas de probabilidad, no garantías
- Se recomienda usarlo en conjunto con otros indicadores o análisis de acción del precio
- En mercados laterales o volátiles, los pivotes pueden cambiar frecuentemente
📝 Notas Técnicas
- El ATR de 10 períodos se usa internamente para calcular el umbral dinámico para la detección de pivotes
- El indicador requiere un mínimo de datos históricos equivalente al doble del parámetro Lookback para funcionar correctamente
- Las líneas y zonas se redibujan solo en la última barra para optimizar el rendimiento 🚀
Resumen
The indicator helps traders identify potential support and resistance zones, define price targets, plan entries on pullbacks, set stop-losses beyond key levels, and confirm reversal zones when price reaches extreme extensions. It works on any timeframe and financial asset, including Forex, stocks, commodities, indices, and cryptocurrencies such as BTCUSD, EURUSD, GBPUSD, XAUUSD, NAS100, and others.
Users can customize parameters like sensitivity, lookback period, direction inversion, and display options (line extension, price and ratio labels, zone opacity, and colors). Colored zones visually highlight key Fibonacci areas for easier interpretation. The indicator updates automatically with new pivots and redraws levels on the latest bar to optimize performance.


