present
가입하고 첫 구매 시 $50 할인을 받으세요
Trading product for MyZTrade High TF candle v1.0 지표 Inside Bar Engulfing, image 1
MyZTrade High TF candle v1.0
지표
버전 1.0, Aug 2026
Windows, Mac
Trading product for MyZTrade High TF candle v1.0 지표 Inside Bar Engulfing, image 2
가입일 28/06/2025

설명

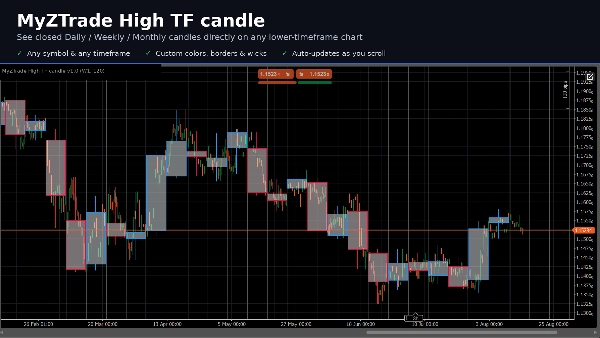
MyZTrade High TF 캔들은 완료된 상위 타임프레임 캔들(일간, 주간 또는 월간 - 선택 가능)을 현재 차트 위에 몸통, 테두리 및 고가/저가 심지와 함께 색상 박스로 오버레이하는 다중 타임프레임 시각화 도구로, 차트를 전환하지 않고 D1 또는 W1 캔들을 보는 것과 유사합니다.

닫힌 상위 타임프레임 캔들만 그려집니다. 아직 형성 중인 캔들은 의도적으로 건너뛰어 해당 기간이 열려 있는 동안 박스 모양이 변하지 않으며, 기간이 완전히 종료된 후에만 나타납니다.

지표 유형: 다중 타임프레임 오버레이 / 가격 행동 컨텍스트 도구. 모든 심볼과 모든 하위 타임프레임(예: M15, H1, H4)에서 작동합니다.

주요 특징:

  • 상위 타임프레임 선택 가능: 일간, 주간 또는 월간
  • 표시되는 박스 수를 구성할 수 있어 긴 이력에서도 차트 로드가 제어됩니다
  • 강세 및 약세 캔들에 대해 별도의 채우기 및 테두리 색상
  • 각 박스에 선택적 고가/저가 심지
  • 차트를 스크롤할 때 자동으로 다시 그리기

거래 활용 사례: 상위 타임프레임의 지지/저항 구역과 일간 또는 주간 바이어스를 읽으면서 하위 타임프레임에서 실행하고, 차트를 왔다 갔다 하지 않고 완료된 상위 타임프레임 범위 내에서 가격이 어떻게 움직이는지 연구합니다.

요약

AI 요약
MyZTrade High TF candle is a multi-timeframe visualization indicator designed to overlay completed higher-timeframe candles—Daily, Weekly, or Monthly—directly onto a lower timeframe chart (e.g., M15, H1, H4). It displays these higher timeframe candles as colored boxes with distinct bodies, borders, and optional high/low wicks, providing a clear view of higher timeframe price action without switching charts. Only fully closed higher timeframe candles are shown, ensuring that the displayed boxes remain static and do not change shape during the current period. Users can configure the number of visible boxes to manage chart load and customize separate fill and border colors for bullish and bearish candles. The indicator automatically redraws when scrolling the chart. This tool aids traders in identifying higher timeframe support and resistance zones and assessing daily or weekly market bias while executing trades on lower timeframes. It supports any symbol and serves as a price-action context tool for enhanced multi-timeframe analysis.
지표 프로필

고객 리뷰

0.0
리뷰: 0
고객 리뷰
이 상품에 대한 리뷰가 아직 없습니다. 이미 사용해 보셨나요? 다른 사람들에게 가장 먼저 소개해 주세요!

상담

자주 묻는 질문(FAQ)

Inside Bar
Engulfing
Fair Value Gap
BOS
Imbalance
CHOCH
Support & Resistance
트레이딩 봇, 지표, 플러그인 등 cTrader Store에서 제공되는 상품은 제3자 개발자에 의해 제공되며, 이는 단순히 정보 및 기술적 접근을 목적으로 제공된 것입니다. cTrader Store는 중개인이 아니며, 투자 조언, 개인별 추천 또는 향후 성과에 대한 어떠한 보장도 제공하지 않습니다.

이 작성자의 상품 더 보기

지표
Volume
Key Levels
+4
Margin Zones its CME-based support/resistance levels from price extremes, helps traders spot entries and exits NKZ zones
지표
Channel
Fibonacci
+5
Market maker levels from key price extremes — catch major reversals and corrections in one click. ver1.2
지표
ATR
EMA
+5
The indicator displays potential reversal zones (support/resistance) on the chart based on the average range (High–Low)

좋아하실 만한 다른 항목

"KANDIKA HEAT MAP" 로고
최고 평점
4.6
(5)
$19
지표
Color-Based Market Pressure & Volatility Visualizer The Kandika Heatmap Indicator
지표
ATR
RSI
+14
A metric that can set 1 to 3 groups of Bollinger Bands
지표
Engulfing
Fibonacci
+4
Six higher-timeframe candle sets on one chart, with liquidity sweep detection and swept levels.
지표
Forex
Crypto
+3
Perfect Trend
지표
SMC
Prop
+12
Multi-TF FVG + Smart Fibonacci
지표
Key Levels
Market Structure
+1
HTF Candle Projector displays the current Higher Timeframe candle (4H or 1H) as a real projected candle LIVE..
지표
Doji
Engulfing
+3
Multi Timeframe OHLC levels (daily, weekly, and monthly), with a two-day price action bias dashboard
지표
Parabolic SAR Alert - Trend reversal alerts with smart signals & custom alerts.
지표
The Break of Structure (BoSCHoCh) Indicator is a smart market structure tool designed to help traders easily spot trend.
지표
ATR
RSI
+24
Daily moving averages, simplified. Displays 3 daily moving averages on lower timeframes with selectable MA types.
지표
AI
ATR
+27
Deep Mood Distribution (DMD) is a segmented volume-profile and sentiment tool that analyzes price action in fixed bar bl
지표
AI
ATR
+10
FX Sniper: Multi-pair Forex analysis tool. Features trend logic, adaptive pivots, and momentum filtering for major pairs
지표
BOS
MSS
+2
Stay ahead with a real-time countdown to candle closes on all key timeframes: 5m, 15m, 30m, 1H, 4H, and Daily.
지표
Prop
Forex
+15
The best filter for trading trend continuations on Renko charts.
지표
Prop
Forex
+14
Stochastic Momentum Index (SMI) for cTrader optional higher-timeframe source, and clear overbought/oversold levels.
지표
Volume
Liquidity Sweep
+1
Liquidity Profiler Tools
지표
ATR
Channel
Reversal Trap Probability Bands plots a dynamic volatility envelope around price & automatically detects "trap" reversal
지표
Volume
Channel
+5
Spots volatility squeezes before they fire — the compression phase everyone else misses.

가격

가입일 28/06/2025