설명
클러스터링 지표
개요
클러스터링 지표는 거래자가 시장 데이터에서 패턴, 추세 및 이상 현상을 식별하는 데 도움을 주기 위해 설계된 강력한 도구입니다. 유사한 데이터 포인트를 클러스터로 그룹화함으로써, 이 지표는 정보에 입각한 거래 결정을 내리는 데 사용할 수 있는 귀중한 통찰력을 제공합니다.
특징
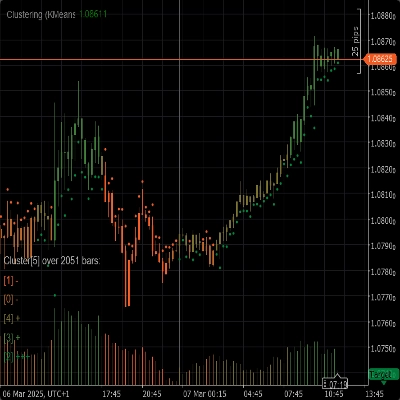
- 클러스터링 알고리즘: K-평균 및 가우시안 혼합 모델(GMM)과 같은 고급 클러스터링 알고리즘을 활용하여 시장 데이터를 효과적으로 분할합니다.
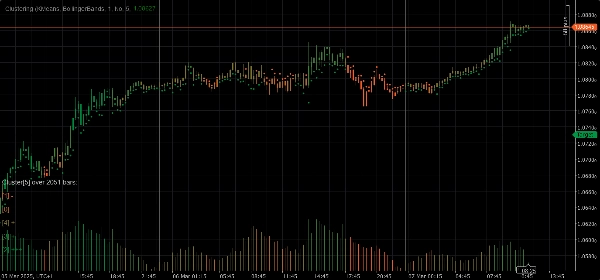
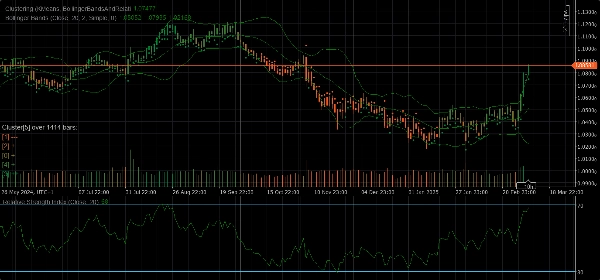
- 특징 세트: 원시 가격, 볼린저 밴드, 상대 강도 지수(RSI), 스토캐스틱 오실레이터, 볼린저 밴드와 RSI, 그리고 이러한 지표들의 조합을 포함한 다양한 특징 세트를 제공하여 시장 행동의 다양한 측면을 포착합니다.
- 동적 클러스터링: 클러스터링이 가능한 한 정확하도록 최적의 클러스터 수를 자동으로 결정합니다.
- 시각화: 차트에서 클러스터 움직임과 변동성에 대한 명확한 시각적 통찰력을 제공합니다.
매개변수
- 클러스터링 알고리즘: 거래 전략에 가장 적합한 K-평균 또는 가우시안 혼합 모델(GMM) 중에서 선택하세요.
- 특징 세트: 원시 가격, 볼린저 밴드, RSI, 스토캐스틱 오실레이터, 볼린저 밴드와 RSI, 또는 다양한 지표를 포함한 전체 시장 데이터 세트 중에서 선택하세요.
- 윈도우: 각 데이터 포인트에 고려할 바의 수를 정의합니다.
- 자동 K: 데이터에 기반하여 클러스터 수를 자동으로 결정합니다.
- 초기 K: 자동 K가 비활성화된 경우 초기 클러스터 수를 설정합니다.
- 최대 과거 바: 클러스터링에 사용되는 최대 과거 바 수를 제한합니다. 0으로 설정하면 사용 가능한 모든 바가 사용됩니다.
- 클러스터별 색상: 실제 클러스터 할당에 따라 차트 색상 변경을 활성화하거나 비활성화합니다.
- 통찰력 표시: 각 클러스터에 대한 자세한 통찰력을 차트에 직접 표시합니다.
- 지표 표시: 특징 세트에 사용된 지표를 표시합니다.
자동 적응 매개변수
- 자동 적응: 지정된 조건에 따라 지표가 클러스터를 재초기화할 수 있도록 자동 적응 모드를 활성화하거나 비활성화합니다.
- 자동 적응 시간: 자동 적응이 발생할 수 있는 하루 중 시간(0-23)입니다.
- 자동 적응 기간: 마지막 적응 이후 최소 경과 시간(시간 단위)으로, 다음 적응이 발생하기 전에 이 시간이 지나야 합니다.
특징 세트 매개변수
볼린저 밴드 매개변수
- 기간: 볼린저 밴드를 계산하는 기간입니다.
- 편차: 볼린저 밴드의 표준 편차 배수입니다.
- 이동 평균 유형: 볼린저 밴드 계산에 사용되는 이동 평균 유형(단순, 지수 등)입니다.
상대 강도 지수(RSI) 매개변수
- 기간: RSI를 계산하는 기간입니다.
스토캐스틱 오실레이터 매개변수
- 기간: 스토캐스틱 오실레이터의 K 기간입니다.
- K 감속: 스토캐스틱 오실레이터의 K 감속 계수입니다.
- D 기간: 스토캐스틱 오실레이터의 D 기간입니다.
- 이동 평균 유형: 스토캐스틱 오실레이터 계산에 사용되는 이동 평균 유형(단순, 지수 등)입니다.
- 계산 유형: 스토캐스틱 오실레이터의 계산 유형(LowHigh, CloseClose 등)입니다.
사용법
1. 클러스터링 지표를 차트에 추가하세요.
2. 거래 전략에 따라 매개변수를 구성하세요.
3. 차트에서 클러스터와 그 움직임을 분석하세요.
4. 지표가 제공하는 통찰력을 사용하여 정보에 입각한 거래 결정을 내리세요.
요약
고객 리뷰
5 | 50 % | |
4 | 50 % | |
3 | 0 % | |
2 | 0 % | |
1 | 0 % |


!["[CB] Pivot Points Pro" 로고](https://cdn.ctrader.com/image/webp/43463c82-67b0-4f10-a4ba-901bba091d81_32594)
!["[Stellar Strategies] Inside Bar with Signals" 로고](https://cdn.ctrader.com/image/webp/1d9e8bfa-3b2c-4440-bb37-5856902008a7_30683)


