
Descrizione
L'indicatore CRT (Candle Range Theory) è uno strumento analitico potente progettato specificamente per i trader che seguono la metodologia ICT (Inner Circle Trader). Questo indicatore identifica i pattern essenziali delle candele legati al CRT, fondamentale per comprendere i movimenti di mercato e l'azione del prezzo.
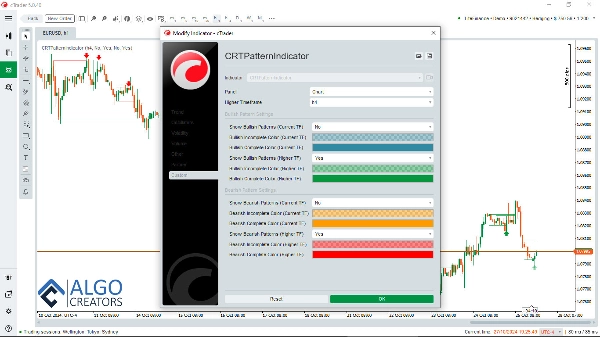
L'indicatore CRT per cTrader è dotato di funzionalità multi-timeframe, che permettono ai trader di visualizzare i pattern CRT di timeframe superiori (HTF) mentre operano su timeframe inferiori (LTF). Questa funzionalità è vitale per ottenere una visione complessiva della struttura del mercato e migliorare le decisioni di trading.
Movimento del prezzo e ICT Power of 3 (AMD):
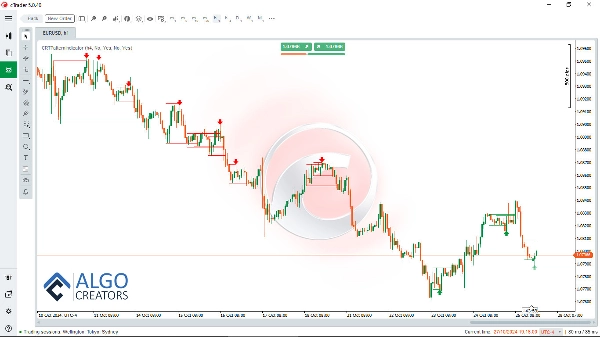
L'indicatore CRT semplifica l'analisi dei movimenti di prezzo e il riconoscimento dei pattern associati al Power of 3 di ICT (Anatomy of Market Dynamics - AMD).
LTF CRT all'interno di un HTF CRT:
Identificando senza sforzo i punti chiave di supporto e resistenza, i trader possono analizzare l'azione del prezzo con molta più chiarezza. Inoltre, l'indicatore CRT evidenzia i pattern HTF e LTF, aiutando i trader a navigare nelle dinamiche dei vari cicli di mercato.
Usa l'indicatore CRT con altri concetti di trading:
Combinare il CRT con altri concetti di trading come FVGs, order blocks e turtle soup aumenta la probabilità di identificare operazioni di successo.
Inoltre, l'indicatore CRT funge da complemento prezioso per l'indicatore Smart Money Assistant , uno strumento avanzato progettato per assistere i trader smart money con informazioni critiche sul mercato e supporto nelle decisioni. Combinati, questi due indicatori creano una cassetta degli attrezzi di trading olistica che migliora la capacità del trader di analizzare e agire.
Scarica Smart Money Assistant: https://ctrader.com/algos/show/3956/
Per potenziare ulteriormente le strategie di trading, l'indicatore FVG Finder può essere utilizzato insieme all'indicatore CRT. Questo strumento rileva le Fair Value Gaps (FVGs) sul grafico, che, se usate in combinazione con i segnali CRT, aumentano la probabilità di effettuare operazioni di successo.
Scarica l'indicatore FVG finder: https://ctrader.com/algos/show/3877/
Integrando questi indicatori, i trader possono stabilire un sistema robusto che sfrutta setup ad alta probabilità, permettendo loro di navigare efficacemente nei mercati e ottimizzare i risultati del trading.
Scarica l'indicatore CRT con Avvisi:: www[dot]AlgoCreators[dot]net
Con CRT, Smart Money Assistant e FVG Finder nella tua cassetta degli attrezzi, puoi massimizzare la comprensione delle tendenze di mercato e migliorare le tue prestazioni di trading complessive, rendendolo una risorsa essenziale per i trader che desiderano eccellere nello stile di trading ICT.
Riepilogo
It simplifies the recognition of price movements related to ICT’s Power of 3 (Anatomy of Market Dynamics - AMD) and highlights critical support and resistance levels. By displaying both higher and lower timeframe patterns, it helps traders interpret market cycles more clearly.
The CRT indicator can be combined with other trading concepts such as Fair Value Gaps (FVGs), order blocks, and turtle soup patterns to enhance trade identification. It also complements the Smart Money Assistant indicator, providing a comprehensive toolkit for smart money trading analysis.
Additionally, pairing the CRT indicator with the FVG Finder, which detects Fair Value Gaps, can improve the probability of successful trades. Together, these tools support the development of robust trading strategies aligned with the ICT style.
Recensioni dei clienti
5 | 83 % | |
4 | 17 % | |
3 | 0 % | |
2 | 0 % | |
1 | 0 % |


