
Описание
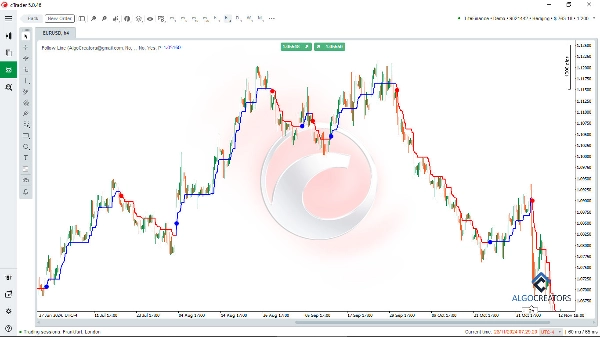
Индикатор Follow Line — это мощный индикатор cTrader для технического анализа, который помогает трейдерам определять оптимальные точки входа и выхода на финансовых рынках. Комбинируя полосы Боллинджера и индикатор ATR, он фильтрует тренды и предоставляет надежные сигналы на покупку и продажу.
С этим индикатором вы легко сможете обнаружить восходящие или нисходящие рыночные тренды и следовать сигналам с высокой степенью уверенности.
Трейдеры могут сочетать индикатор Follow Line с продвинутыми инструментами, такими как cTrader Smart Money Assistant и осцилляторы типа MACD для улучшения анализа и подтверждения входов в сделки.
Его настраиваемые параметры и оповещения в реальном времени делают его ценным дополнением к любой торговой стратегии, позволяя пользователям выполнять успешные сделки с уверенностью и точностью.
Ключевые особенности:
- Обнаружение тренда: Используйте Follow Line для определения бычьих или медвежьих рыночных трендов.
- Сигналы покупки/продажи: Отображение точных сигналов на покупку и продажу на основе пробоев полос Боллинджера.
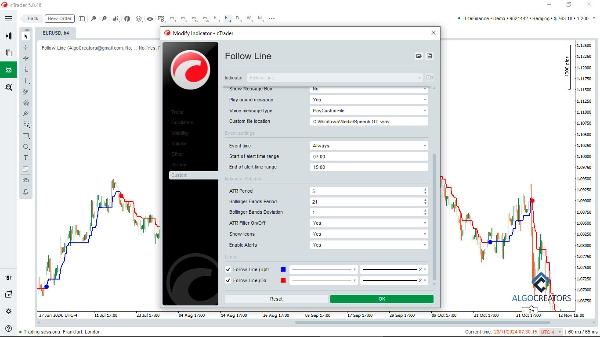
- Фильтр ATR: Возможность включения или отключения фильтра ATR для повышения точности сигналов.
- Настраиваемые параметры: Регулировка периода полос Боллинджера, стандартного отклонения и периода ATR.
- Визуальное отображение: Отображение сигналов на графике с помощью интуитивно понятных иконок (стрелок или линий).
- Оповещения: Получайте мгновенные оповещения при появлении сигнала на покупку или продажу.
Этот индикатор обладает высокой настраиваемостью, позволяя трейдерам регулировать периоды полос Боллинджера, стандартные отклонения и настройки ATR в соответствии со своей стратегией. Визуальные подсказки и мгновенные оповещения делают его удобным и эффективным как для скальпинга, так и для свинг-трейдинга. Благодаря таким функциям, как обнаружение тренда, управление рисками и настраиваемые параметры, индикатор Follow Line идеально подходит для трейдеров на форекс, криптовалютном и фондовом рынках, стремящихся улучшить свой технический анализ и торговые результаты.
Идеально подходит для точного определения рыночных возможностей!
Сводка
Users can customize settings such as Bollinger Bands period, standard deviation, and ATR period to align with their trading strategies. The indicator visually represents signals on the chart using intuitive icons like arrows or lines and provides real-time alerts when signals occur. It supports various trading styles, including scalping and swing trading, and is suitable for forex, cryptocurrency, and stock markets.
The Follow Line indicator can be combined with other tools like the cTrader Smart Money Assistant and MACD oscillators to confirm trade entries and enhance analysis. Its customizable features and alert system assist traders in identifying precise market opportunities and managing risk effectively.
Отзывы покупателей
5 | 60 % | |
4 | 20 % | |
3 | 20 % | |
2 | 0 % | |
1 | 0 % |


