
Descrizione
▁▂▃▄▅▆▇ █ 10.000+ trader (istituzionali + retail) █ ▇▆▅▄▃▂▁
- Scegli i nostri indicatori TOP in cTrader 🏆
- ✨ Precisione esclusiva per risultati superiori ✨
- 📈 I nostri algoritmi —con le visualizzazioni più apprezzate 🎯—
- sono stati implementati con successo in 2 fondi quant
▁▂▃▄▅▆▇ █████████████████████████████ ▇▆▅▄▃▂▁
_______________________________________________
_______________________________________________
📌 Indicatori di Struttura di Mercato
· ✅ AdvancedMarket Structure: Bos, Choch, SwinLevels, Order Blocks, Market Structure& Liquidity Finder
· 🔄 Analisi Dinamica della Struttura di Mercato dei Punti di Inversione
· 🧱 Order Block
· ⛓️ BOS & CHOCH
· 🧠 ICT Power of 3
· 🌀 Zone di Polarità di Mercato
______________________________________________________________-
Store cBots : 🧠 Gold & BTC BreakoutSession Pivots 🧠
_______________________________________________
🔚 Sistemi di Uscita Intelligenti
· 📍 Algoritmo Intelligente a Inseguimento
_______________________________________________
📐 Indicatori ZigZag
· 🔍 Proiezione di Liquidità Prezzo ZigZag
· ➖ ZigZag
· 🎯 Tracciatore di Estremità Zig-Zag
_______________________________________________
🧱 Indicatori di Supporto e Resistenza
· 🟩 Linee di Supporto e Resistenza SmartTrend
· 🧱 Tutti i Livelli di Supporto e Resistenza
_______________________________________________
📊 Indicatori di Trend e Canale
· 📊 Supertrend
· ⚡Analizzatore di Trend Momentum
· 💥 Sistema di Breakout del Canale
· 🌈 Gradiente Dinamico di Trend
_______________________________________________
💧 Strumenti di Volume e Liquidità
· 🔥 Mappa di Calore Volume POC
· 📉 Mappa di Liquidazione Leva
_______________________________________________
⚡ Indicatori Momentum e RSI
· 🔎 Tracciatore di Bias a Candela Multi-Livello
_______________________________________________
🔮 Strumenti di Predizione e Proiezione
· 📐 Predizione Basata su Linreg& ATR
· 📏 Regressione Lineare Fibonacci Multi-timeframe
· 📈 Proiettore di Flusso di Mercato Alimentato dal Volume
📉 Ventaglio di Pitch Fibonacci
______________________________________________________________________________________________________
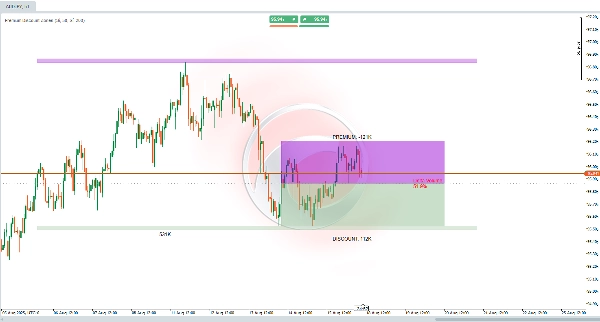
Cosa Fa l'Indicatore Premium Discount Zones? 🎯
Questo indicatore è progettato per aiutarti a identificare aree chiave basate sui recenti massimi e minimi di mercato. Analizza un periodo configurabile di barre passate per determinare un intervallo di prezzo generale, calcola un equilibrio del punto medio, e divide quell'intervallo in due zone principali:
- 🔺 Premium (Zona Superiore)
- 🟩 Discount (Zona Inferiore)
Valuta anche il volume di trading in quelle barre per calcolare un "Volume Delta", che rappresenta la percentuale di volume associata ai movimenti ribassisti.
A Cosa Serve? 💡
Questo indicatore ti aiuta a individuare aree in cui il prezzo potrebbe essere:
- 📈 Sopravvalutato (Zona Premium) → Potenziale per vendere o prendere profitti
- 📉 Sottovalutato (Zona Discount) → Potenziale per acquistare o accumulare
Fornisce una visione rapida degli squilibri di mercato, evidenziando se il volume recente favorisce movimenti rialzisti o ribassisti. Le zone strutturali estese proiettano livelli chiave oltre l'intervallo immediato, utili per pianificare operazioni in trend o inversioni. 🚀
Perfetto per strategie che mirano a intervalli di consolidamento, breakout, trading istituzionale o analisi della liquidità!
Come Interpretarlo? 🔍
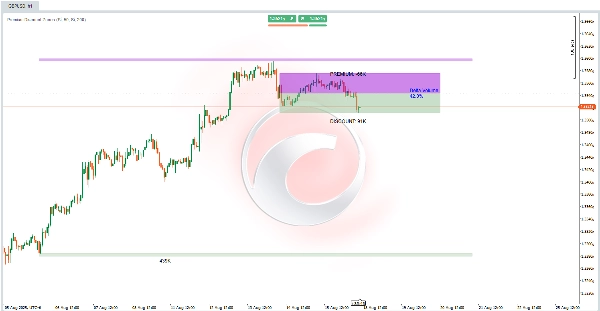
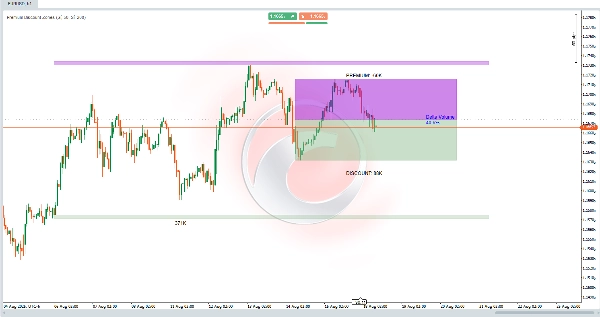
- 🟣 Zona Premium (Viola, Sopra l'Equilibrio) → Intervallo superiore, dove il prezzo è considerato "costoso."
- 🟢 Zona Discount (Verde, Sotto l'Equilibrio) → Intervallo inferiore, dove il prezzo è visto come "economico."
- ⚖️ Linea di Equilibrio (Grigia, Centro) → Segna il punto medio dell'intervallo, agendo come livello di bilanciamento. Un crossover del prezzo qui può segnalare un cambio di bias.
- 📊 Volume Delta (Centro) → Mostra la percentuale di volume ribassista (🔴 >50% = ribassista, 🔵 <50% = rialzista).
- 🏛 Zone Strutturali (Estensioni Ombreggiate) → Aree estese sopra/sotto gli estremi dell'intervallo, che fungono da supporto/resistenza a lungo termine con un margine basato sull'azione recente del prezzo.
L'indicatore aggiorna dinamicamente queste zone sulle barre recenti, estendendole verso destra per proiezioni future.
Come Usarlo nel Trading? 🛠️
- Configurazione Iniziale:
-
- Abilita livelli PD (principali) e zone strutturali se desiderato.
- Regola i periodi di lookback:
-
- Breve (es. 50 barre) → Intervalli recenti
- Lungo (es. 200 barre) → Contesto strutturale
- Analisi del Grafico (es. Timeframe H1):
-
- Verifica se il prezzo è in 🟣 Premium (considera vendite con conferma ribassista) o 🟢 Discount (considera acquisti con conferma rialzista).
- Usa Volume Delta per conferma:
-
- 🔴 >50% → Favorisce short in Premium
- 🔵 <50% → Favorisce long in Discount
- Strategie di Entrata e Uscita:
-
- 🟢 Acquista in Zona Discount: Se il prezzo entra nella zona verde & il delta è basso, cerca entrate long con stop sotto il minimo della zona e target all'equilibrio o Premium.
- 🟣 Vendi in Zona Premium: Se il prezzo raggiunge la zona viola & il delta è alto, considera short con stop sopra il massimo della zona e target all'equilibrio o Discount.
- 🏛 Usa le Zone Strutturali per operazioni a lungo termine, applicando il margine come margine di errore.
Riepilogo
The indicator also computes a Volume Delta, representing the percentage of volume associated with bearish movements, which helps confirm market bias: values above 50% favor bearish conditions, while values below 50% favor bullish conditions. Extended structural zones project key support and resistance levels beyond the immediate range, useful for planning trades in trending or reversal markets.
Users can adjust lookback periods to focus on recent ranges or broader structural context. The indicator dynamically updates these zones and extends them forward for future projections. It supports trading strategies involving consolidation ranges, breakouts, institutional trading, and liquidity analysis by providing visual cues on price valuation and volume-driven market imbalances.


![Logo di "[Stellar Strategies] Market Structure Breakout"](https://cdn.ctrader.com/image/webp/bceec265-3247-4b11-915f-6295a29c106d_28465)


