Descrizione
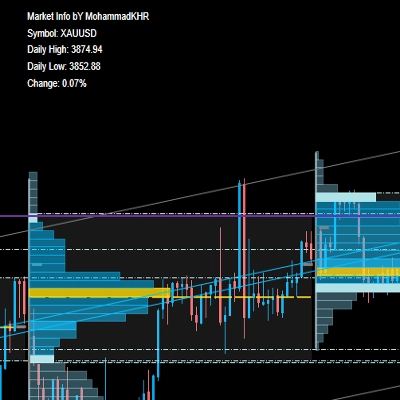
Indicatori Pinescriptlabs Store: Pinescriptlabs Store cBots : (cBot) Gold & BTC BreakoutSession Pivots(nuovo)
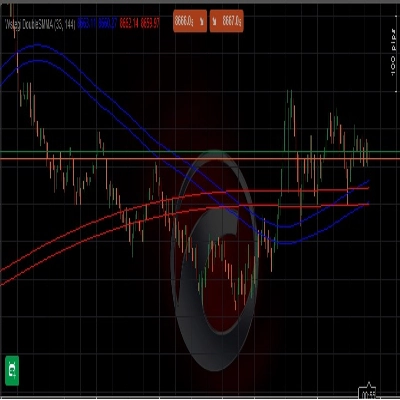
Trailing Smart Algorithm(Nuovo)
Prediction Based on Linreg & ATR
SmartTrend Support &
Resistance
Lines
Dynamic
Market Structure
Analysis
of
Turning
Points
Fibonacci
Linear
Regression
Multi-timeframe
Multi-Level
Candle Bias
Tracker
Auto
Support and
Resistance
Trend
Lines
All
Support and
Resistance
Levels
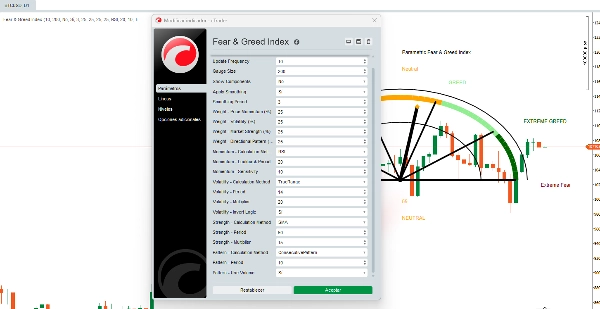
Fear & Greed Index
L'indice Fear & Greed è un algoritmo visivo avanzato che sintetizza il sentimento di mercato in un valore da 0 a 100 utilizzando un indicatore semicircolare. A differenza delle versioni base, questo strumento è completamente personalizzabile, permettendo ai trader di modificare ogni aspetto del suo calcolo.
📊 I 4 Componenti Principali (Configurabili)
1️⃣ Momentum del Prezzo *(Peso Configurabile: 0-100%)*
6 Metodi di Calcolo Disponibili:
- PriceChange: Variazione % semplice rispetto al periodo precedente
- ROC: Tasso di variazione normalizzato
- RSI: RSI modificato per il momentum
- SMADeviation: Deviazione del prezzo dalla SMA
- EMADeviation: Deviazione del prezzo dalla EMA
- MACD: Segnale MACD come indicatore di momentum
🔧 Parametri Personalizzabili:
- Periodo di lookback *(5-100)*
- Sensibilità del calcolo *(1.0-50.0)*
2️⃣ Volatilità *(Peso Configurabile: 0-100%)*
6 Metodi di Calcolo Disponibili:
- TrueRange: Volatilità basata sul True Range
- HighLowRange: Semplice intervallo High-Low
- CloseToClose: Volatilità logaritmica close-to-close
- ATR: Standard Average True Range
- StandardDev: Deviazione standard del prezzo
- ParkinsonVol: Stima della volatilità di Parkinson
🔧 Parametri Personalizzabili:
- Periodo di calcolo *(5-50)*
- Moltiplicatore di volatilità *(1.0-100.0)*
- Inversione logica (maggiore volatilità = più paura)
3️⃣ Forza del Mercato *(Peso Configurabile: 0-100%)*
6 Metodi di Calcolo Disponibili:
- SMA: Posizione relativa alla Media Mobile Semplice
- EMA: Posizione relativa alla Media Mobile Esponenziale
- VWAP: Posizione relativa al Prezzo Medio Ponderato per Volume
- HLBand: Posizione all'interno della banda High-Low
- BollingerPos: Posizione all'interno delle Bande di Bollinger
- PivotDistance: Distanza dai punti pivot
🔧 Parametri Personalizzabili:
- Periodo di calcolo *(10-200)*
- Moltiplicatore di forza *(1.0-50.0)*
4️⃣ Pattern Direzionale *(Peso Configurabile: 0-100%)*
6 Metodi di Calcolo Disponibili:
- BullBearRatio: Rapporto candele rialziste/ribassiste
- VolumePattern: Analisi della tendenza del volume
- BodySizePattern: Analisi della dimensione del corpo della candela
- WickPattern: Analisi del pattern delle ombre
- GapPattern: Rilevamento e analisi dei gap
- ConsecutivePattern: Analisi dei movimenti consecutivi del prezzo
🔧 Parametri Personalizzabili:
- Periodo di analisi *(5-30)*
- Uso del volume nei calcoli (opzionale)
⚙️ Funzionalità Avanzate
🔹 Sistema di Ponderazione Flessibile
- Pesi personalizzati per componente *(0-100%)*
- Auto-normalizzazione se i pesi non sommano al 100%
- Avvisi per configurazioni subottimali
🔹 Smussatura Intelligente
- Smussatura opzionale per ridurre il rumore
- Periodo di smussatura regolabile *(1-10)*
- Filtro SMA applicato ai risultati finali
🔹 Visualizzazione Completamente Personalizzabile
- Dimensione del gauge *(50-500px)*
- Frequenza di aggiornamento *(1-50 barre)*
- Scomposizione opzionale dei componenti (mostra valori individuali)
- Si adatta automaticamente a strumento e timeframe
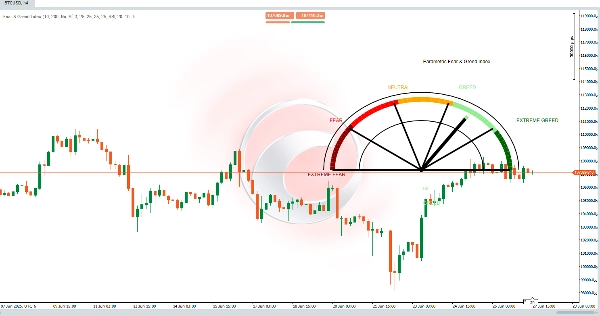
🔄 Processo dell'Algoritmo
Passo 4: Visualizzazione
Il gauge semicircolare mostra 5 zone colorate:
- 0-20: Paura estrema
- 21-40: Paura
- 41-60: Neutrale
- 61-80: Avidità
- 81-100: Avidità estrema
✅ Sistema Completamente Personalizzabile:
🎯 Massima Flessibilità
- Si adatta a qualsiasi mercato: Forex, Crypto, Azioni, Commodities
- Specifico per timeframe: impostazioni diverse per scalping vs. swing trading
- Evolve con il mercato: adatta le strategie al cambiare delle condizioni
Riepilogo
Recensioni dei clienti
5 | 100 % | |
4 | 0 % | |
3 | 0 % | |
2 | 0 % | |
1 | 0 % |