Candle Pro
อินดิเคเตอร์
121 ดาวน์โหลด
เวอร์ชัน 1.0, Oct 2025
Windows, Mac
5.0
รีวิว: 1
คำอธิบาย
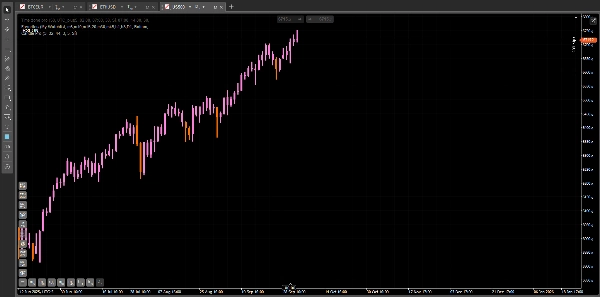
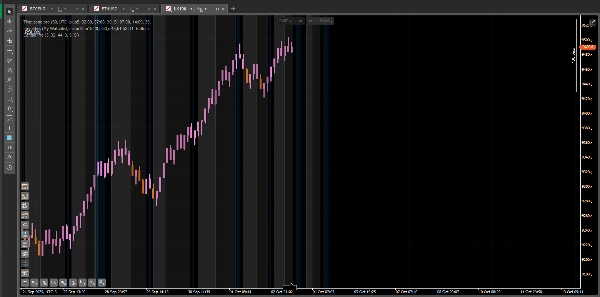
Candle Pro – สัญญาณ RSI แบบภาพบนแท่งเทียน
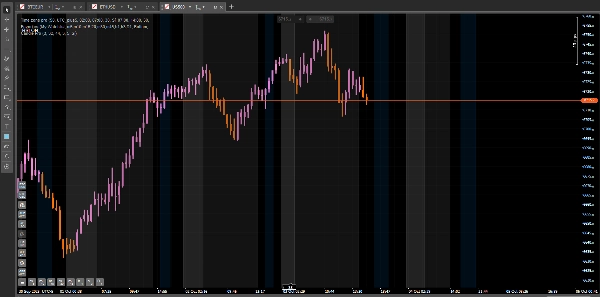
Candle Pro คืออินดิเคเตอร์ที่เน้นแท่งเทียนโดยตรงบนกราฟเมื่อ RSI ถึงระดับซื้อมากเกินไปหรือลงทุนมากเกินไป ช่วยให้คุณโฟกัสที่การเคลื่อนไหวของราคาและหลีกเลี่ยงแผนภูมิย่อยเพิ่มเติม
🧭 วิธีใช้
- เพิ่มอินดิเคเตอร์ลงในกราฟของคุณ
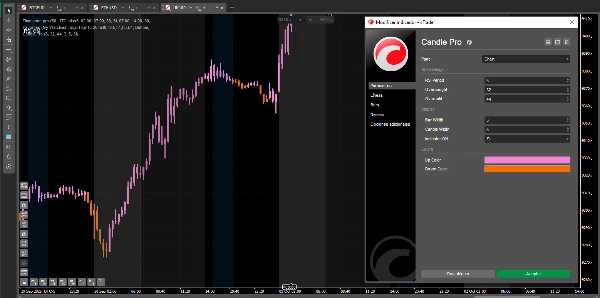
- ปรับพารามิเตอร์ RSI ให้เหมาะกับสไตล์การเทรดของคุณ
- สังเกตว่าแท่งเทียนเปลี่ยนสีที่ระดับสุดขีด ซึ่งเป็นการบ่งชี้โซนที่อาจเกิดการกลับตัวหรือแรงโมเมนตัม
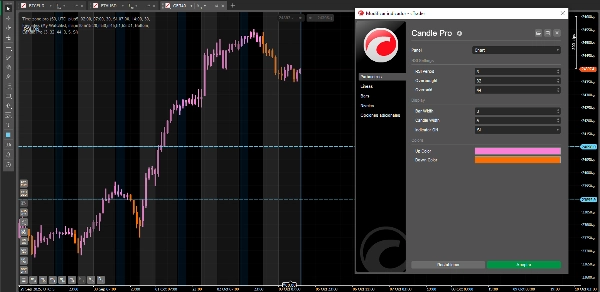
⚙️ การตั้งค่าที่แนะนำ
สำหรับการตอบสนองที่รวดเร็วและแม่นยำ:
- ช่วง RSI: 3
- ซื้อมากเกินไป: 32
- ขายมากเกินไป: 44
- ความกว้างแท่งเทียน: 3
- ความกว้างแท่งบาร์: 1
✨ ประโยชน์
- สัญญาณภาพที่ชัดเจนโดยตรงบนราคา
- ใช้งานได้กับสัญลักษณ์และกรอบเวลาทุกประเภท
- สีและความกว้างเส้นที่ปรับแต่งได้อย่างเต็มที่
- เหมาะสำหรับ การเก็งกำไรระยะสั้น, การเทรดภายในวัน และ การเทรดสวิง.
หมายเหตุ: นี่คือ เวอร์ชันฟรี ของ Candle Pro. เวอร์ชัน พรีเมียม กำลังจะมาเร็วๆ นี้ พร้อมฟีเจอร์พิเศษที่จะยกระดับการเทรดของคุณไปอีกขั้น
สรุป
สรุปโดย AI
Candle Pro is a trading indicator designed to visually highlight RSI (Relative Strength Index) signals directly on price candles, eliminating the need for separate RSI sub-charts. It marks candles on the chart when RSI reaches overbought or oversold levels, helping traders identify potential reversal or momentum zones. Users can customize RSI parameters, candle colors, and line widths to suit their trading style. The indicator supports any symbol and timeframe, making it suitable for scalping, intraday, and swing trading strategies. Suggested settings include an RSI period of 3, overbought level at 32, and oversold level at 44 for fast and precise signals. Candle Pro emphasizes clean visual cues integrated with price action to maintain chart clarity. This version is the free edition, with a premium version planned to offer additional features. Supported markets include Forex, Indices, and Crypto.
โปรไฟล์อินดิเคเตอร์
รีวิวจากลูกค้า
5.0
รีวิว: 1
5 | 100 % | |
4 | 0 % | |
3 | 0 % | |
2 | 0 % | |
1 | 0 % |
รีวิวจากลูกค้า
November 3, 2025
This is an interesting indicator it really helps to filter out market noise. Thanks
การสนทนา
คำถามที่พบบ่อย
Forex
Indices
RSI
Crypto
ผลิตภัณฑ์ที่มีให้บริการผ่าน cTrader Store รวมถึงบอทการเทรด อินดิเคเตอร์ และปลั๊กอิน มีให้บริการโดยนักพัฒนาบุคคลที่สามและมีไว้เพื่อวัตถุประสงค์ในการเข้าถึงข้อมูลและทางเทคนิคเท่านั้น cTrader Store ไม่ใช่โบรกเกอร์และไม่ได้ให้คำแนะนำการลงทุน คำแนะนำส่วนบุคคล หรือการรับประกันผลการดำเนินงานในอนาคต


!["[Hamster-Coder] Pivot Points MTF" โลโก้](https://cdn.ctrader.com/image/webp/4c143e5a-309c-40e3-a578-f04d1e133ffa_31159)


ราคา
ตั้งแต่ 24/02/2025
15
การขาย
1.83K
ติดตั้งฟรี