คำอธิบาย
🚀 เทรดเดอร์กว่า 10,000 คนใช้ ตัวชี้วัด🏆 ชั้นนำของเราแล้ว
ค้นพบเหตุผลที่มืออาชีพเลือกเรา – เครื่องมือที่ทรงพลังที่สุดบน cTrader (ตัวชี้วัด, อัลกอริทึม และ cBots) กำลังรอคุณอยู่
👉 รับระบบชั้นนำทั้งหมดของเราที่นี่:
_______________________________________________
📌 ตัวชี้วัดโครงสร้างตลาด
· ✅ AdvancedMarket Structure: Bos, Choch, SwinLevels, Order Blocks, Market Structure& Liquidity Finder
· 🔄 การวิเคราะห์โครงสร้างตลาดแบบไดนามิกของจุดเปลี่ยน
· 🧱 บล็อกคำสั่ง
· ⚖️ ความไม่สมดุลของตลาด
· ⛓️ BOS & CHOCH
· 🧠 ICT Power of 3
· 🌀 โซนขั้วตลาด
_______________________________________________
🔚 ระบบออกอัจฉริยะ
_______________________________________________
📐 ตัวชี้วัด ZigZag
· 🔍 การฉายภาพสภาพคล่องราคาของ ZigZag
· ➖ ZigZag
· 🎯 ตัวติดตามความสุดขั้วของ Zig-Zag
_______________________________________________
🧱 ตัวชี้วัดแนวรับและแนวต้าน
· 🟩 เส้นแนวรับและแนวต้าน SmartTrend
· 🧱 ระดับแนวรับและแนวต้านทั้งหมด
_______________________________________________
📊 ตัวชี้วัดแนวโน้มและช่องทาง
· 📊 Supertrend
· ⚡ตัววิเคราะห์แนวโน้มโมเมนตัม
· 🔁 ค่าเฉลี่ยเคลื่อนที่ตอบสนอง
_______________________________________________
💧 เครื่องมือปริมาณและสภาพคล่อง
· 🔍 ช่องว่างมูลค่ายุติธรรมโมเมนตัม
· 🕒 เซสชันช่องว่างมูลค่ายุติธรรม
_______________________________________________
⚡ ตัวชี้วัดโมเมนตัมและ RSI
· 🔎 ตัวชี้วัดความลำเอียงของแท่งเทียนหลายระดับ
ตัวติดตาม
_______________________________________________
🔮 เครื่องมือทำนายและฉายภาพ
· 📐 การทำนายโดยใช้ Linreg& ATR
· 📏 ฟีโบนักชีการถดถอยเชิงเส้นหลายกรอบเวลา
· 📈 เครื่องฉายภาพการไหลของตลาดที่ขับเคลื่อนด้วยปริมาณ
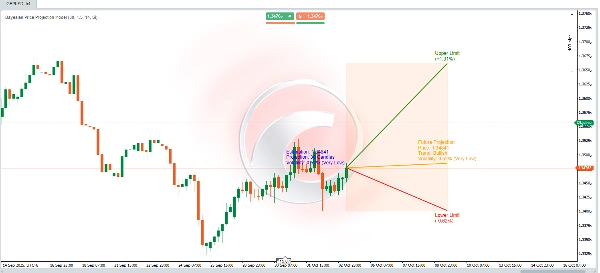
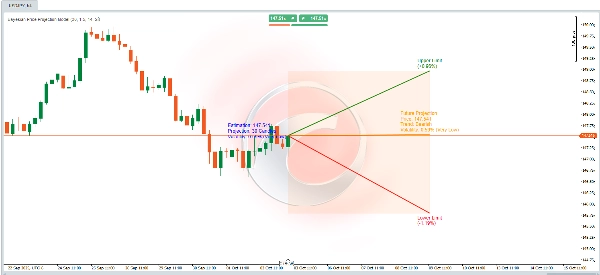
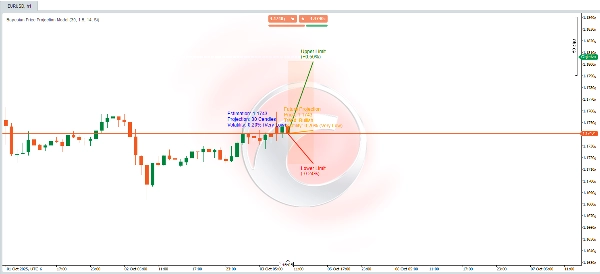
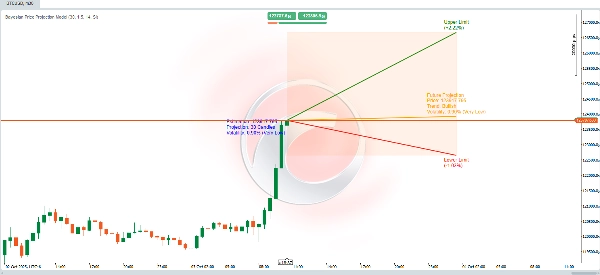
📊 อัลกอริทึมฉายภาพราคาที่ไดนามิก 📈
อัลกอริทึมนี้ผสมผสาน **การคำนวณทางสถิติ** , **การวิเคราะห์ทางเทคนิค** และ **ทฤษฎีเบย์** เพื่อทำนายราคาล่วงหน้า พร้อมทั้งให้ **ช่วงความไม่แน่นอน** ที่แสดงขอบเขตบนและล่าง การคำนวณออกแบบมาเพื่อปรับการฉายภาพโดยพิจารณาจาก **แนวโน้มตลาด** , **ความผันผวน** และความน่าจะเป็นในอดีตของการทำจุดสูงสุดหรือต่ำสุดใหม่
วิธีการทำงานมีดังนี้:
🚀 การฉายภาพราคาล่วงหน้า
การคำนวณแบบไดนามิกประเมินราคาล่วงหน้าจากสามองค์ประกอบหลัก:
1. **แนวโน้ม**: กำหนดว่าตลาดมีแนวโน้มที่จะเคลื่อนไหวขึ้นหรือลง
2. **ความผันผวน**: วัดขนาดของการเปลี่ยนแปลงที่คาดหวังโดยอิงจากความผันผวนในอดีต
🧠 **การปรับความน่าจะเป็นแบบเบย์**
- ความน่าจะเป็นมีเงื่อนไขถูกคำนวณโดยใช้ **สูตรของเบย์** :
\[
P(A|B) = \frac{P(B|A) \cdot P(A)}{P(B)}
\]
แบบจำลองเหตุการณ์ในอนาคตโดยใช้ข้อมูลมีเงื่อนไข:
- **ความน่าจะเป็นที่จะทำจุดสูงสุดใหม่ตลอดกาล** หากราคามีแนวโน้มขึ้น
- **ความน่าจะเป็นที่จะทำจุดต่ำสุดใหม่ตลอดกาล** หากราคามีแนวโน้มลง
- ความน่าจะเป็นเหล่านี้ช่วยปรับปรุงการประเมินราคาล่วงหน้าโดยพิจารณา:
- **ความผันผวนที่สูงขึ้น** เพิ่มโอกาสในการถึงระดับสุดขั้ว (สูง/ต่ำ)
- **แนวโน้มตลาด** มีผลต่อทิศทางการเคลื่อนไหวของราคา
🌟 **การคำนวณความผันผวน**
- ความผันผวนถูกวัดโดยใช้ตัวชี้วัด **ATR (Average True Range)** ที่มีหน้าต่าง 14 ช่วงเวลา ซึ่งสะท้อนความกว้างเฉลี่ยของความผันผวนราคา
- เพื่อแสดงความผันผวนเป็นเปอร์เซ็นต์ ATR จะถูกทำให้เป็นมาตรฐานโดยการหารด้วยราคาปิดและคูณด้วย 200
- จากนั้นความผันผวนจะถูกจัดประเภทเป็นระดับคำอธิบาย (เช่น **ต่ำมาก**, **ต่ำ**, **ปานกลาง** เป็นต้น) เพื่อการตีความที่ดีขึ้น
---
🎯 **ขอบเขตการเบี่ยงเบน (บนและล่าง)**
- ขอบเขตบนและล่างสร้าง **ช่วงที่คาดการณ์ไว้** รอบราคาที่ประเมินล่วงหน้า เพื่อให้กรอบความไม่แน่นอน
- ขอบเขตเหล่านี้คำนวณโดยการปรับ ATR ด้วย:
- **ตัวคูณ** ที่ผู้ใช้กำหนด (`factor_desviacion`)
- **ความน่าจะเป็นแบบเบย์** ที่คำนวณก่อนหน้า
- **รากที่สองของช่วงเวลาที่คาดการณ์** (`proyeccion_dias`) ซึ่งรวมหลักการที่ว่าความไม่แน่นอนเพิ่มขึ้นตามเวลา
🔍 **การตีความแบบจำลอง**
นี่สามารถมองว่าเป็น **แบบจำลองความน่าจะเป็นแบบไดนามิก** ที่:
- ผสมผสาน **การวิเคราะห์ทางเทคนิค** (แนวโน้มและ ATR)
- ปรับปรุงความน่าจะเป็นโดยใช้ **ทฤษฎีเบย์**
- ให้ **ช่วงการฉายภาพเชิงภาพ** เพื่อช่วยให้คุณเข้าใจการเคลื่อนไหวของราคาที่อาจเกิดขึ้นในอนาคตและความไม่แน่นอนที่เกี่ยวข้อง
⚡ ไม่ว่าคุณจะวิเคราะห์ **ตลาดที่ผันผวน** หรือยืนยัน **สถานการณ์กระทิง/หมี** เครื่องมือนี้จะช่วยให้คุณมีวิธีการที่แข็งแกร่งและขับเคลื่อนด้วยข้อมูล! 🚀