
Descrizione
✔ Sito web per inserire i dati, inserire la scheda indicatori: https://tradingeconomics.com/
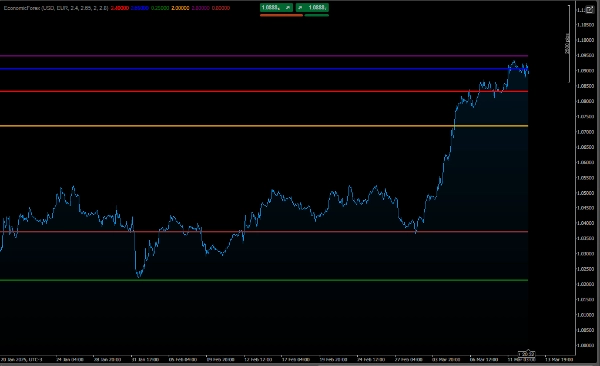
Come interpretare il grafico
Differenza tra tassi di interesse nominali e reali:
Il tasso di interesse nominale è il valore lordo del tasso di interesse.
Il tasso di interesse reale tiene conto dell'inflazione, mostrando il potere d'acquisto reale del denaro.
Se l'inflazione è superiore al tasso di interesse nominale, il tasso di interesse reale sarà negativo, indicando una perdita di potere d'acquisto.
Confronto tra valute:
Il grafico consente di confrontare le condizioni economiche delle due valute.
Ad esempio, se il tasso di interesse reale della valuta principale è superiore a quello della valuta controparte, ciò può indicare che la valuta principale è più attraente per gli investimenti.
Evoluzione nel tempo:
Le linee mostrano come l'inflazione, il tasso di interesse nominale e il tasso di interesse reale cambiano nel tempo, permettendo di identificare le tendenze.
Esempio d'uso
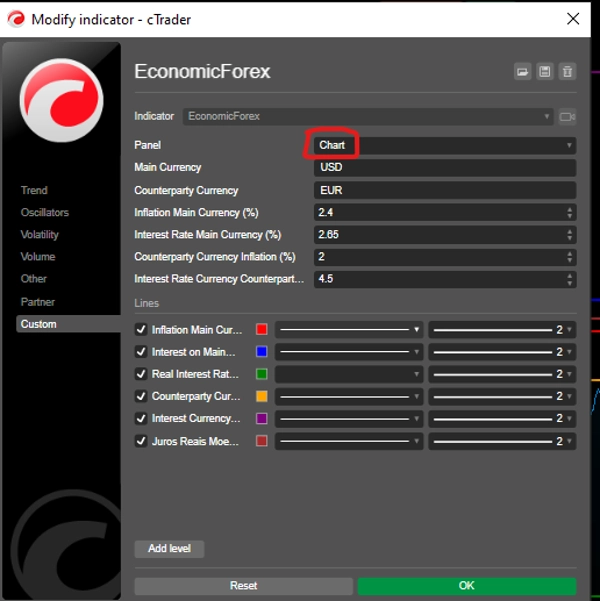
Supponiamo di impostare i parametri come segue:
Valuta principale: USD (Dollaro USA)
Inflazione: 5%
Tasso di interesse nominale: 6,5%
Valuta controparte: EUR (Euro)
Inflazione: 2%
Tasso di interesse nominale: 4%
Il grafico mostrerà:
USD:
Interesse reale: 1,5% (6,5% - 5%)
EUR:
Interesse reale: 2% (4% - 2%)
Con questo, puoi confrontare le condizioni economiche di USD ed EUR e prendere decisioni informate nel mercato forex.
Conclusione
Questo codice è uno strumento utile per trader e analisti che vogliono monitorare e confrontare gli indicatori economici di due valute in una coppia forex. Fornisce informazioni su inflazione, tassi di interesse nominali e tassi di interesse reali, aiutando a comprendere lo scenario macroeconomico e le sue implicazioni per il mercato forex.
vedi questo algoritmo a basso rischio:👇🏻
https://ctrader.com/pt/products/601?u=carneiroads
https://ctrader.com/pt/products/623?u=carneiroads
Riepilogo
The indicator distinguishes between nominal interest rates (the gross interest rate) and real interest rates (adjusted for inflation), highlighting the purchasing power of money. It allows comparison of economic conditions between a main currency and a counterparty currency by plotting their respective inflation, nominal, and real interest rates over time. This helps identify trends and relative investment attractiveness; for example, a higher real interest rate in the main currency compared to the counterpart may indicate greater investment appeal.
Users input data such as inflation and nominal interest rates for each currency, which can be sourced from economic data websites like TradingEconomics.com. The tool supports informed decision-making in the forex market by providing a clear view of evolving economic factors affecting currency pairs.


