
Descrizione
COSA FA
Fibonacci Channel risolve un problema che la maggior parte degli strumenti Fibonacci ignora: dove si ancora conta più dei livelli che si tracciano.
La maggior parte dei trader applica manualmente i ritracciamenti di Fibonacci — scegliendo un massimo e un minimo oscillante, tracciando lo strumento e sperando che la struttura regga. Il risultato è un'istantanea statica che diventa irrilevante nel momento in cui il prezzo supera uno dei due estremi.
Questo indicatore cambia l'approccio.
Invece di ancorarsi a un'oscillazione fissa, Fibonacci Channel si ancora a un punto a tua scelta e traccia continuamente il massimo più alto e il minimo più basso da quell'ancora fino alla barra corrente. Man mano che l'intervallo si espande, il canale si espande con esso. I livelli di Fibonacci riflettono sempre l'intervallo reale che si è sviluppato — non un'ipotesi storica.
Il canale cresce con il mercato. I livelli rimangono significativi.
La direzione viene tracciata automaticamente. In un contesto rialzista, i livelli si misurano dall'alto verso il basso. In un contesto ribassista, si misurano dal basso verso l'alto. Nessuna regolazione manuale necessaria — l'indicatore legge la struttura e si orienta di conseguenza.
PERCHÉ FIBONACCI BASATO SULL'ANCORA?
Il Problema
Gli strumenti Fibonacci standard sono tracciati tra due punti fissi. Nel momento in cui il prezzo supera uno dei due estremi, lo strumento non è più valido — devi ridisegnarlo manualmente. Questo crea un ciclo costante di aggiustamenti e la mappa di Fibonacci non riflette mai accuratamente l'intero intervallo che si è effettivamente sviluppato.
C'è anche un problema più profondo: dove posizioni l'ancora definisce tutto. Una posizione arbitraria produce livelli arbitrari.
La Soluzione
Fibonacci Channel ti dà un controllo deliberato sul punto di ancoraggio — e poi gestisce tutto automaticamente da lì. Posiziona l'ancora su una barra strutturalmente significativa (un inizio di trend, una inversione chiave, un'apertura di sessione) e l'indicatore costruisce l'intero intervallo in avanti da quel punto. Ogni nuovo massimo o minimo che il mercato fa diventa parte del canale. I livelli di Fibonacci si aggiornano in tempo reale.
L'ancora è trascinabile. Spostala sul grafico e l'intero canale si ridisegna istantaneamente.
Perché Modalità Multiple?
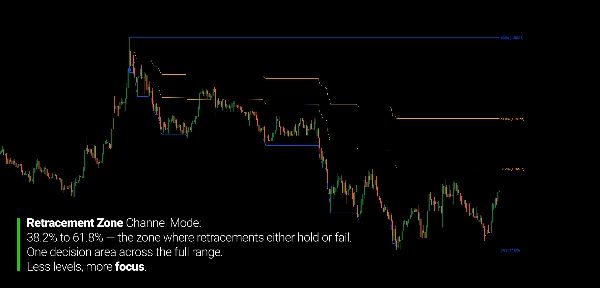
La griglia completa di Fibonacci non è sempre ciò di cui hai bisogno. A volte l'attenzione è sulla zona di ritracciamento tra il 38,2% e il 61,8%. A volte vuoi isolare la struttura solo nella metà superiore o inferiore dell'intervallo.
Sette modalità di canale distinte ti permettono di applicare esattamente il livello di dettaglio che la situazione richiede — senza ingombrare il grafico con livelli che non usi.
IL CONCETTO FONDAMENTALE
L'indicatore funziona in un unico passaggio in avanti dall'ancora:
- Posizioni l'icona dell'ancora su una barra a tua scelta
- Da quella barra in avanti, l'indicatore traccia il massimo più alto e il minimo più basso in corso
- I confini del canale (Linea Alta, Linea Bassa) riflettono questo intervallo in espansione
- I livelli di Fibonacci sono calcolati all'interno dell'intervallo, orientati dalla direzione del trend
- Sposta l'ancora — il canale si ricalcola immediatamente
La direzione del trend è determinata confrontando la chiusura corrente con il prezzo di apertura della barra di ancoraggio. Rialzista: i livelli si misurano dall'alto verso il basso partendo dal massimo. Ribassista: i livelli si misurano dal basso verso l'alto partendo dal minimo. Quando il contesto direzionale del mercato cambia, il canale si ri-orienta automaticamente.
L'ancora si aggancia agli orari e ai prezzi di apertura delle barre per una posizione pulita e riproducibile.
MODALITÀ DEL CANALE
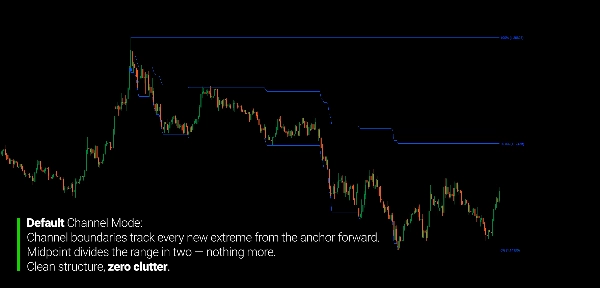
Predefinito Solo Linea Alta, Linea Bassa e Linea Media. Vista pulita dei confini dell'intervallo senza livelli interni.
Zona di Ritracciamento Aggiunge i livelli 61,8% e 38,2% — la zona di ritracciamento principale all'interno dell'intervallo completo. Ideale per identificare l'area primaria di pullback all'interno di un movimento.
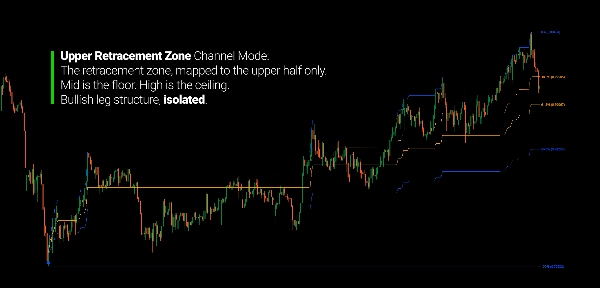
Zona di Ritracciamento Superiore Zona di ritracciamento mappata sulla metà superiore del canale (tra Mid e High). Utile per isolare la struttura di ritracciamento all'interno di una gamba rialzista.
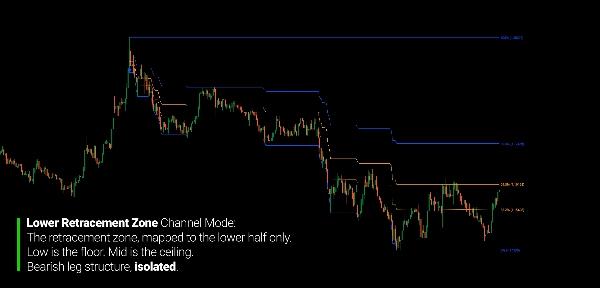
Zona di Ritracciamento Inferiore Zona di ritracciamento mappata sulla metà inferiore (tra Low e Mid). Stessa logica applicata alle gambe ribassiste.
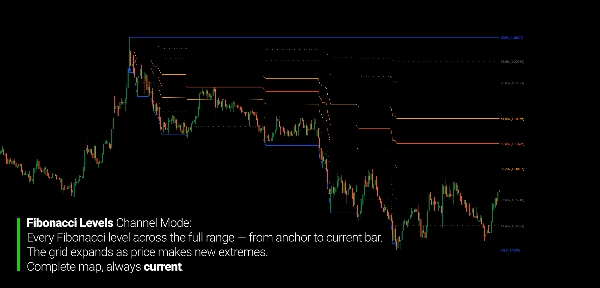
Livelli di Fibonacci Griglia completa di Fibonacci su tutto l'intervallo: 88,6%, 78,6%, 61,8%, 50%, 38,2%, 23,6%, 11,4%. Per i trader che vogliono la mappa completa dei livelli.
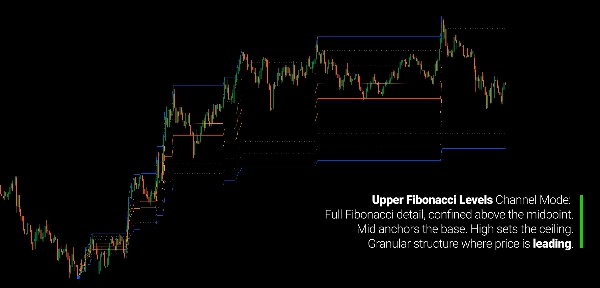
Livelli di Fibonacci Superiori Griglia completa di Fibonacci applicata solo alla metà superiore del canale.
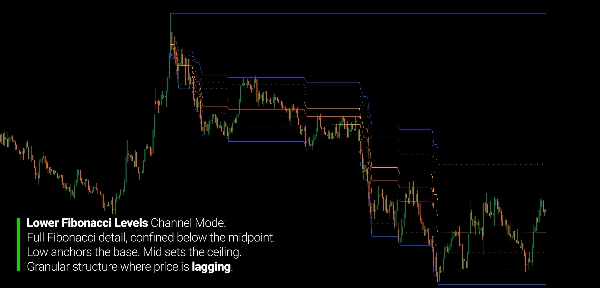
Livelli di Fibonacci Inferiori Griglia completa di Fibonacci applicata solo alla metà inferiore del canale.
LETTURA DEL GRAFICO
- Linea Alta: Confine superiore del canale (massimo più alto dall'ancora)
- Linea Bassa: Confine inferiore del canale (minimo più basso dall'ancora)
- Linea Media: Punto medio dell'intero intervallo
- 61,8% / 38,2%: Zona di ritracciamento principale (linee arancioni)
- 50%: Livello di ritracciamento medio (rosso-arancione)
- 78,6% / 88,6% / 23,6% / 11,4%: Livelli estesi di Fibonacci (puntinati grigi)
- Icona Ancora: Trascinabile — spostala per ridefinire dove inizia il canale
Riferimento Direzionale:
- Contesto rialzista → i livelli si orientano dall'alto verso il basso (High = 0%, Low = 100%)
- Contesto ribassista → i livelli si orientano dal basso verso l'alto (Low = 0%, High = 100%)
- La direzione si aggiorna automaticamente quando l'ultima chiusura supera l'apertura dell'ancora
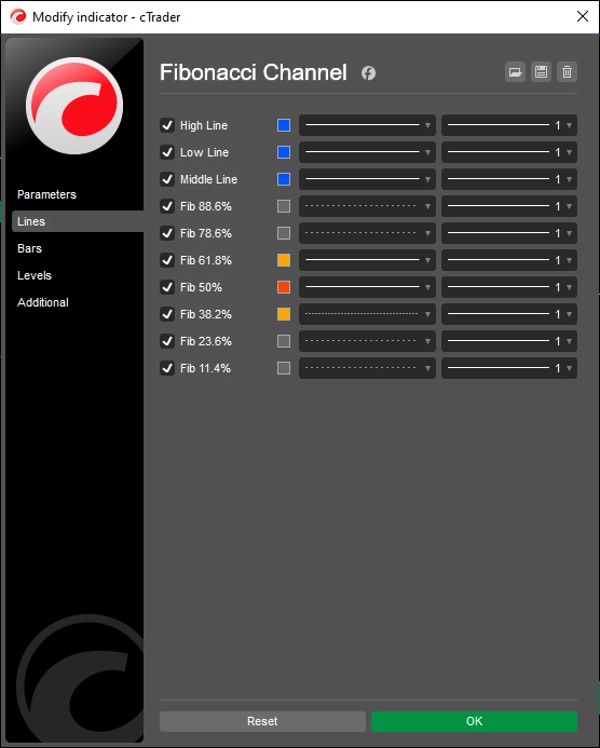
PARAMETRI
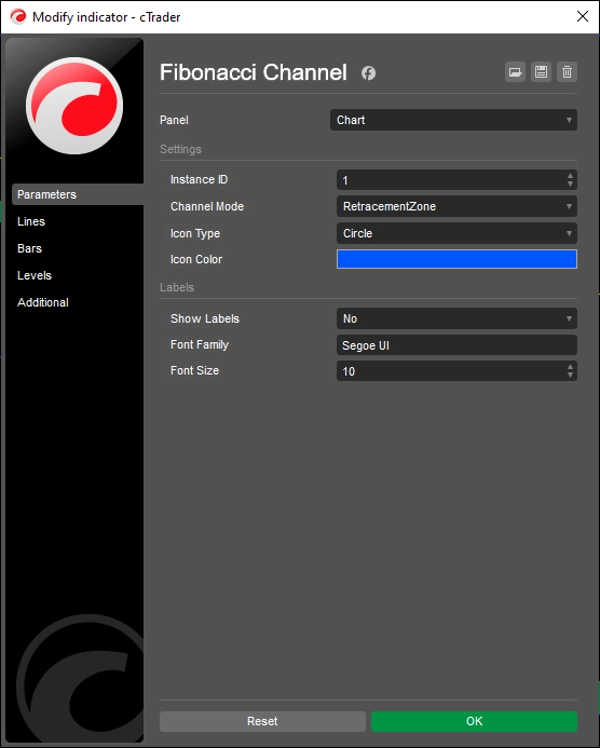
Impostazioni
- ID istanza — supporta più canali indipendenti sullo stesso grafico
- Modalità Canale — seleziona quali livelli visualizzare (7 modalità)
- Tipo Icona — stile visivo dell'ancora trascinabile
- Colore Icona — colore del marcatore dell'ancora
Etichette
- Mostra Etichette — attiva/disattiva le etichette di prezzo a ogni livello
- Famiglia di Font — tipo di carattere delle etichette
- Dimensione Font — dimensione delle etichette (6–32)
A CHI È RIVOLTO
Questo indicatore è per i trader che usano l'analisi di Fibonacci come riferimento strutturale piuttosto che come strumento di segnale meccanico.
Se hai passato tempo a ridisegnare gli strumenti Fibonacci ogni volta che il prezzo fa un nuovo estremo — o hai scoperto che i ritracciamenti statici smettono di riflettere il mercato dopo le prime barre — questo indicatore è stato creato proprio per questo.
È adatto a trader swing e di posizione che vogliono una mappa Fibonacci che rimanga valida mentre il prezzo si sviluppa, trader di range e struttura che lavorano con i confini del canale e le zone di ritracciamento come riferimenti di entrata o uscita, e utenti multi-istanza che vogliono tracciare più canali indipendenti sullo stesso strumento simultaneamente.
L'ancora trascinabile lo rende pratico nell'uso in tempo reale: imposta l'inizio del canale in un punto che conta strutturalmente e lascia che l'indicatore mantenga la mappa da lì. Nessun ridisegno, nessun aggiornamento manuale.
Non è un generatore di segnali. È un quadro di riferimento strutturale per i trader che usano i livelli di Fibonacci come contesto — non come trigger di entrata.
COSA LO RENDE DIVERSO
La maggior parte degli strumenti Fibonacci è statica: due punti fissi, una mappa fissa. Questo è dinamico — l'intervallo si espande mentre il prezzo si sviluppa e i livelli riflettono sempre l'intervallo reale dalla tua ancora scelta fino alla barra attuale.
La maggior parte delle implementazioni Fibonacci richiede una configurazione manuale della direzione. Questo legge automaticamente il contesto rialzista e ribassista e orienta tutti i livelli di conseguenza — senza alcuna modifica dei parametri da parte del trader.
La maggior parte degli strumenti canale offre un solo layout. Questo offre sette modalità distinte, da una vista pulita dei confini a una griglia completa di Fibonacci applicata all'intero intervallo o a metà indipendentemente. Il grafico mostra esattamente il livello di dettaglio di cui hai bisogno per il contesto che stai analizzando.
Più istanze possono funzionare simultaneamente con ancore indipendenti — ognuna tracciando un segmento strutturale diverso senza interferire l'una con l'altra.
---
COMPRENDERE LA STRUTTURA DI FIBONACCI
I rapporti di Fibonacci non sono predittivi. Descrivono relazioni proporzionali all'interno degli intervalli di prezzo — relazioni che i trader hanno osservato ripetersi nei mercati e nei timeframe per decenni. Se ciò rifletta proprietà matematiche dei mercati o semplicemente un comportamento collettivo intorno a livelli ben noti è una questione aperta. Ciò che conta per l'uso pratico è più semplice.
Un canale Fibonacci definisce l'intervallo di un movimento e lo divide in zone proporzionalmente significative. I trader usano queste zone per valutare se un pullback è superficiale o profondo, se un ritracciamento regge o fallisce, e se il prezzo si sta avvicinando a un'area dove la struttura è stata storicamente significativa.
Il valore di un approccio basato sull'ancora è che mantiene l'analisi ancorata a un evento strutturale specifico. Il canale non inizia in un punto arbitrario — inizia dove decidi che il movimento rilevante è iniziato. Questa decisione spetta a te in base alla tua lettura del grafico. Il ruolo dell'indicatore è mantenere la mappa accuratamente da quel punto in avanti, così i livelli rimangono validi finché la struttura che misurano rimane intatta.
---
Il trading comporta rischi. Questo indicatore è uno strumento di analisi tecnica — applica sempre una corretta gestione del rischio.
Riepilogo
Recensioni dei clienti
5 | 100 % | |
4 | 0 % | |
3 | 0 % | |
2 | 0 % | |
1 | 0 % |


